Basic Concepts
When data is not normally distributed or when the presence of outliers gives a distorted picture of the association between two random variables, Spearman’s rank correlation is a non-parametric test that can be used instead of the Pearson’s correlation coefficient.
On this webpage, we will explain the basic concepts about Spearman’s correlation and how to calculate it. Click here to find out how to perform hypothesis testing to determine whether Spearman’s correlation statistically equal to zero (i.e. to determine whether two samples are independent).
Definition 1: The Spearman’s rank correlation (also called Spearman’s rho) is Pearson’s correlation coefficient on the ranks of the data.
Example
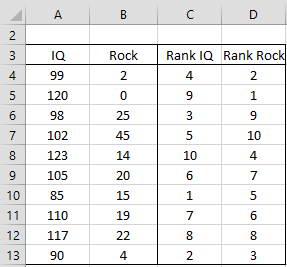
Example 1: Range A3:B13 of Figure 1 associates the IQ of each adolescent in a sample with the number of hours they listen to rock music per month. Determine the strength of the correlation between IQ and listening to rock music using both Pearson’s correlation coefficient and Spearman’s rank correlation. Compare the results.
Figure 1 – Data for Example 1
To calculate Spearman’s rho, we need to determine the rank of each IQ score among all the IQ scores and each Rock score among all the Rock scores. E.g. the rank of the first IQ score (cell A4 in Figure 1) can be determined by using the formula =RANK.AVG(A4,A$4:A$13,1), and so we put this formula in cell C4. If you are using Excel 2007 you would use the Real Statistics function RANK_AVG instead of RANK.AVG (as explained in Ranking).
We now calculate both correlation coefficients as follows:
Pearson’s correlation = CORREL(A4:A13,B4:B13) = -0.036
Spearman’s rho = CORREL(C4:C13,D4:D13) = -0.115
We see that there isn’t much of a correlation between IQ and listening to rock music based on the sample, although Pearson’s correlation coefficient is a little closer to zero than the Spearman’s rho.
Outliers
When conducting an analysis, if you discover the presence of outliers (e.g. via a histogram or scatter diagram), proceed as follows:
Calculate the Pearson’s correlation coefficient for the sample with and without the outliers. If there isn’t much difference, then you can be pretty confident that the outliers are not influencing the results. You can also calculate the Spearman’s rank coefficient. If this is pretty similar to Pearson’s correlation coefficient, this is also a good indicator that the outliers are not substantially influencing the results.
If there are clear differences then you will need to be cautious about how you treat the outliers.
Similarly, if you test the sample data for the x and y variables and see that either one of them is not roughly normal (using the techniques described in Testing for Normality and Symmetry), then you should use Spearman’s coefficient rather than Pearson’s.
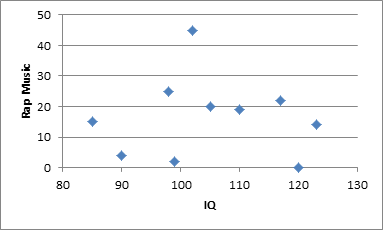
Figure 2 displays a scatter diagram for the data in Example 1. We see that the data is pretty randomly scattered although there is a potential outlier where the rap music listening spikes to 45. This gives some evidence that Spearman’s rho might be a better choice.
Figure 2 – Scatter diagram for data from Example 1
Worksheet Formulas
Spearman’s rho for the data in ranges R1 and R2 can be calculated in Excel via the formula
=CORREL(RANK.AVG(R1,R1,1),RANK.AVG(R2,R2,1))
For versions of Excel prior to Excel 2010, the following formula will do the job.
=CORREL(RANK(R1,R1,1)+(COUNTIF(R1,R1)-1)/2,RANK(R2,R2,1)+(COUNTIF(R2,R2)-1)/2)
Real Statistics Function: The Real Statistics Resource Pack supplies the following function:
SCORREL(R1, R2) = Spearman’s rho for the data in ranges R1 and R2
For Example 1, SCORREL(A4:A13,B4:B13) = -0.115.
No Ties
When there are no ties in the ranking, there is alternative way of calculating Spearman’s rho using the following property.
Property 1: When there are no ties, Spearman’s rho is equal to
where di = rank xi – rank yi.
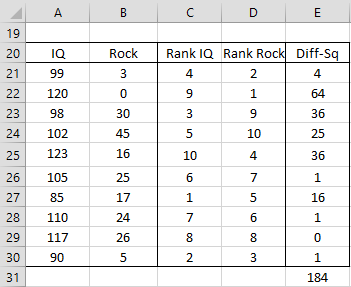
Example 2: Calculate Spearman’s rho for the data from Example 1 using Property 1.
Figure 3 – Alternative way of calculating rho for Example 1
Using Property 1 and the data in Figure 3:
To find out how to test whether Spearman’s correlation coefficient is statistically equal to zero (i.e. to determine whether two samples are independent) click here.
Observation: A matrix of pairwise Spearman’s correlations can be calculated via the array formula =CORR(RANKCOL(R1)).
Examples Workbook
Click here to download the Excel workbook with the examples described on this webpage.
References
eGyanKosh (2017) Unit 2: other types of correlation
http://egyankosh.ac.in/bitstream/123456789/20956/1/Unit-2.pdf
Wikipedia (2015) Spearman’s rank correlation coefficient
https://en.wikipedia.org/wiki/Spearman%27s_rank_correlation_coefficient


Hello,
another problem from my students… some of them, using Mac, cannot apply the formula SCORREL, Excel result is a #NAME? error. Surprisingly, Kendall KCORREL works without any problem.
Do you have any advice for that?
Thanks a lot!
Simone
Hello Simone,
I just checked, and I see that inadvertantly omitted the SCORREL function from the latest Mac release. I will restore this function in the next release, which should be available in the next few days.
In the meantime, if you just need to calculate Spearman’s correlation for data in R1 and R2, you can use the formula
=CORREL(RANKS(R1),RANKS(R2))
Charles
Hello Charles,
I have question about correlation. I have two sets of observations (600 obs). One set (A) is composed by numbers between-30 and +40, while the other (B) is composed by zero and 1. I calculated the correlation between the two sets and got, for Spearman, 0.44. Indeed, I am interested in understanding the strength of the correlation between the value of A when they are below or above a certain level (<-15) and the set of obs. B. To do so I changed the first set of data (A) in a binary data set (o,1), where 1 is set when the original value is =15. I then calculated again Spearman correlation and got 0.59.
Proceeding in this way, did I calculate the correlation I wanted that is “the correlation between the value of A when they are below or above a certain level (<-15) and the set of obs. B."?
Thanks,
Giorgio
Hello Giorgio,
What have you concluded?
Charles
Hello Charles,
In my opinion I did calculate the correlation I wanted to find. I can say that I have a higher correlation when I consider my cutoff value (-15) compared to the correlation I get when I consider the original dataset.
The first dataset represents temperatures in Celsius.
The second dataset represents a status of fever: 0 “fever” and 1 “No fever”
I want to check with which temperature, among the dataset, I have the higher correlation with the status “fever” and “no fever”. Did I proceed correctly in your view?
Thanks.
Giorgio
P.s. above I made a typo, the correct sentence is: “where 1 is set when the original value is > =-15”
Giorgio,
If I understand correctly, your first correlation is between A, taking numeric values in an interval, and B taking values 0 or 1. For the second correlation A and B both take values 0 or 1. Am I understanding this correctly?
Charles
Hello Charles,
Sorry for the late reply. Yes, you are right.
Thanks,
Roberto
Hello Charles,
Did you have the time to look at the issue?
Thanks,
Giorgio
Thank you, Charles
Hello M. Charles
is it possible to use this test in flood frequency analysis? Like a data of time (years) and Flows(annual peak flows) variables
Regards
Hello N.F.,
If I understand correctly (see https://serc.carleton.edu/hydromodules/steps/168500.html) this sort of analysis is done by fitting data to one of several distributions. This sort of approach is supported by Real Statistics.
Charles
Hello Prof Charles,
I have 22 sectors of my data and want to calcualte spearsman rank correltion and kandell tau correlation. In some data points there is zero, i meant that Sectors 5 and 6 are zero and other have value when i used the fomula of rank avg they give me the rank of sectors 5 and sector 6 21.5 and 21.5 respectively. SO what should i do ? do i need to consider them in correlation anaylsis or remove from the analyis and secondly i am comparing two years data, if one year have these two sector and other dont then what should i do?
Waiting for your positive respons. Thanks
Hello MSKTK,
I am not sure what the sectors represent. Does each sector consist of a set of data? Are you calculating correlations based on pairs of these 22 sectors?
In general, if you calculate the correlation between two data sets, it is entirely possible that one or more pairs can have the same value. In this case, you still retain this pair in the calculation.
Charles
Thank you for your prompt and kind response. These sectors are derived from input and output tables that represent the region’s economy. The sectors include farming, forestry, agriculture, mining, petroleum, and services, among others. I aim to analyze the differences among these sectors using statistical techniques across various years and regions. If the sectors appear similar, I plan to cluster them for further analysis. If you come across any other statistical methods suitable for this type of data, please let me know. is such a clustering technique a good option or not? Thanks in advance!
Hi ,
thank you for the great tool. That helps me a lot with small jobs as part of my studies.
However, I am a little confused about using the add-on. Maybe because this instructions on this page work without the add-on?!
When using the add-on, do I have to determine the ranks of the given data beforehand if I want to calculate the rho – or – does the add-on do that for me?
If that’s the case, can I just mark my data from the Likert-skala-answer (1-4) in the list in exel to the input range 1 & 2 in the add-on and that’s it?
I look forward to hearing from you!
Many Thanks!
Johannes
Hi Johannes,
You don’t need to determine the ranks. The add-in will do this for you.
Charles