Basic Concepts
Somers’ d statistic is a measure of (asymmetric) association. d takes values between -1 and 1. A value of 1 or -1 means that the independent variable perfectly predicts the dependent variable: +1 when the relationship is positive and -1 when the relationship is negative. A value of 0 means that there is no relationship between the independent and dependent variables, and the independent variable is no help in predicting the dependent variable.
Somers’ d is like the gamma statistic in that it is based on ordinal variables, but whereas gamma is a symmetric measure of association, d is an asymmetric measure of association. Somers’ d is like the lambda statistic in that both are asymmetric measures of association, but whereas lambda only requires categorical variables, Somers’ d requires ordinal variables.
Definition
Somers’ asymmetric association is computed from the nij data in a contingency table by the formula
![]()
where C and D are calculated as for the gamma statistic.
We assume that the columns represent the dependent variable and the rows the independent variable, n = the total number of frequencies, and
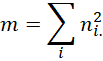
d is an estimate for the population value of Somers’ δ.
Standard error of d
If the contingency table has r rows and c columns, then the standard error of d is
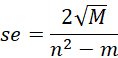
where
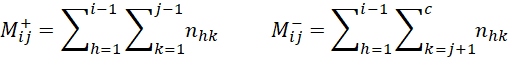
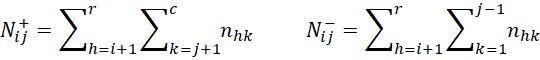
![]()
M+ij is the sum of the values in the cells in the range shown in Figure 1, and similarly for M–ij, N+ij, and N–ij.
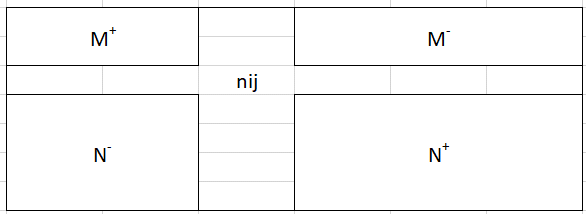
Figure 1 – Somers’ d regions
Hypothesis Testing and Confidence Interval
You can test the hypothesis that d = d0 via
![]()
A confidence interval for d is
![]()
Example
Example 1: Repeat Example 1 for the Gamma Measure of Association using Somers’ asymmetric association statistic.
The left side of Figure 2 contains the contingency table for the example plus the calculation of C and D. The right side of the figure shows how to calculate Somers’ d, the two-tailed hypothesis test, and 95% confidence interval. We see that there is a significant association.
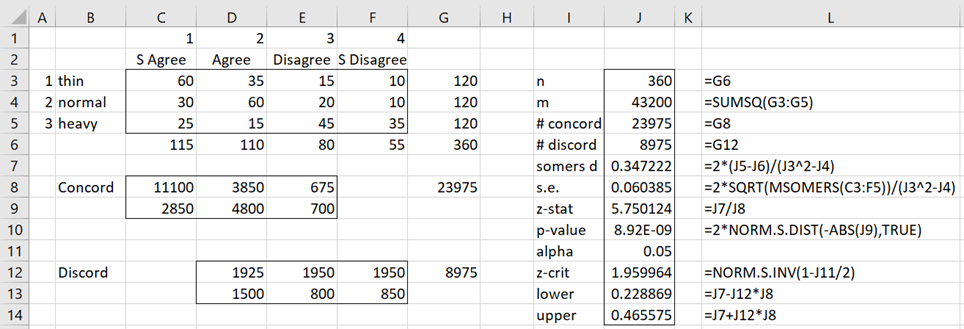
Figure 2 – Somers’ d statistic and test
Worksheet Functions
Real Statistics Functions: The Real Statistics Resource Pack provides the following function for R1 that contains a contingency table (w/o headings or totals).
SOMERS_TEST(R1, lab, alpha, d0): returns a column array with Somers’ d, # of concordance pairs, # of discordance pairs, standard error, z-statistic, p-value, and the lower and upper ends of the 1-alpha confidence interval for d.
MSOMERS(R1) = M used to calculate the standard error
If lab = TRUE (default FALSE) then an extra column of labels is appended to the output. alpha is the significance level (default .05). The z-statistic is equal to (d – d0)/s.e. If d0 is omitted, it defaults to zero. Note that the confidence interval is based on d0 = 0 even when d0 is specified.
For Example 1, the formula =SOMERS_TEST(C3:F5,TRUE) produces the output shown in Figure 3.
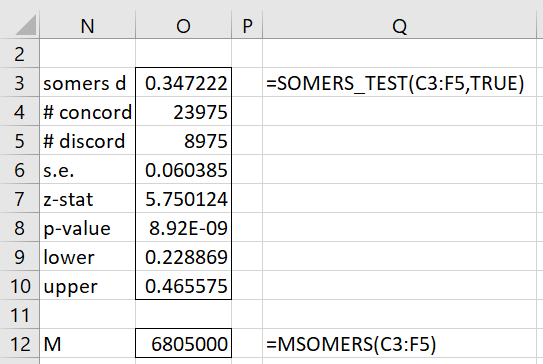
Figure 3 – Real Statistics SOMERS_TEST function
Data Analysis Tool
Real Statistics Data Analysis Tool: The Real Statistics Resource Pack provides the Association Tests data analysis tool that can be used to calculate Somers’ d statistic and can be used to test whether δ = δ0.
This is done in a manner similar to that shown in Lambda Coefficient (except that the Somers option is chosen instead of the Lambda option).
Examples Workbook
Click here to download the Excel workbook with the examples described on this webpage.
References
Siegel, S., Castellan, N. J. (1988) Nonparametric statistics for the behavioral sciences, 2nd ed.
https://psycnet.apa.org/record/1988-97307-000
Laerd Statistics (2023) Somers’ d using SPSS statistics
https://statistics.laerd.com/spss-tutorials/somers-d-using-spss-statistics.php