Objective
Suppose we have a contingency table with m rows and n columns. Further, suppose that the element in the ith row and jth column is aij. Our goal now is to find the value of ρ which maximizes the log-likelihood function LL where
We can accomplish this by using Excel’s Solver.
Example
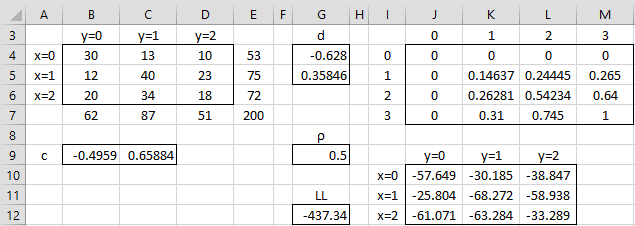
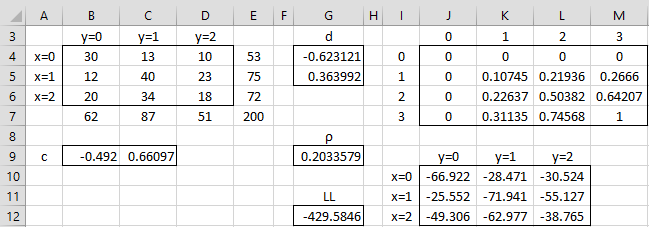
Example 1: Calculate the polychoric correlation coefficient for the data in the 3 × 3 contingency table (range B4:D6) of Figure 2.
Figure 2 – 3 × 3 contingency table
We use a two-step approach. First, we calculate the values of the x threshold coefficients c1 and c2 and the y threshold coefficients d1 and d2. Second, we use Solver to identify the value of ρ which maximizes LL.
Here, m = 3 and n = 3. We estimate c1, c2, d1 and d2 (in cells B9, C9, G4 and G5) by
= NORM.S.INV(53/200) = -.49585
= NORM.S.INV(128/200) = .77186
= NORM.S.INV(62/200) = -.62801
= NORM.S.INV(149/200) = .35846
We next calculate the value of LL (cell G12) using the formula =SUM(J10:L12) based on an initial guess of ρ = .5. Here, range J10:L12 uses the values in range J4:M7. This range contains all zeros in the first row and column and 1 in the last row/column (cell M7). Cell K5 contains the formula =BNORMSDIST($G4,B$9,$G$9,TRUE). Highlighting range K5:L6, we press Ctrl-D and Ctrl-R to fill in the remaining cells in K5:L6. Finally, cells K7, L7, M5, and M5 contain the worksheet formulas =NORM.S.DIST(B9, TRUE), =NORM.S.DIST(C9, TRUE), =NORM.S.DIST(G4, TRUE), =NORM.S.DIST(G5, TRUE).
Finally, we insert the formula =B4*LN(K5-K4-J5+J4) in cell J10, highlight the range J10:L12, and press Ctrl-D and Ctrl-R.
Solution using Solver
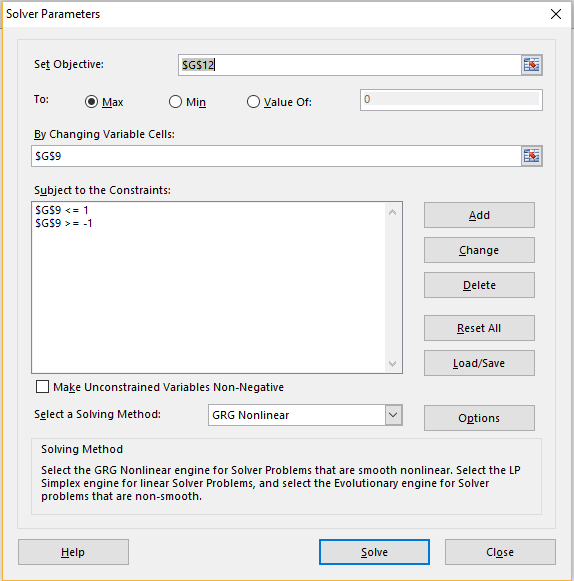
We now select Data > Analysis|Solver and then fill in the dialog that appears as shown in Figure 3.
Figure 3 – Solver dialog box
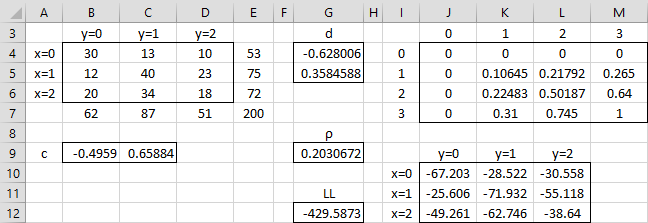
After pressing the Solve button, the output shown in Figure 4 appears.
Figure 4 – Polychoric correlation coefficient
We see that Solver has calculated the polychoric correlation coefficient to be .20307 (cell G9).
Sensitivity
Since formulas in the range J10:L12 use the natural log function, it is possible that at the extremes (i.e. when ρ is close to 1 or -1), the log of zero will occur, resulting in an error.
If Solver is unable to converge to a solution, it is likely that you have encountered this problem. One approach to resolving this issue is to restrict the acceptable values for rho. E.g. you could change the constraints (shown in Figure 3) to values such as G9<=.98 and G9>=-.97 (the actual constraints would vary with the specific data values). Fortunately, this is not necessary for our example.
Another approach is to enter the formula =IFERROR(B4*LN(K5-K4-J5+J4),-100000000) in cell J10 in the procedure described above. Here, -100000000 is any very large negative number that will cause the resulting LL to be rejected as a candidate for the maximum value.
Modifications
We can also calculate the value of the polychoric correlation coefficient whereby the initial values for the x and y threshold coefficients are allowed to vary during the iterative process of maximizing LL.
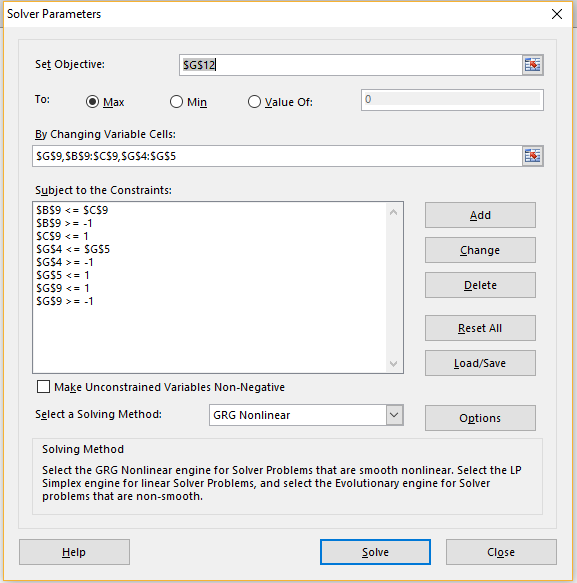
We again use Solver as shown in Figure 5, but this time we also allow all the values in range B8:C9 and G4:G5 to vary.
Figure 5 – Revised Solver dialog box
The output is shown in Figure 6.
Figure 6 – Improved polychoric correlation coefficient
Note that the value calculated for the polychoric correlation coefficient is ρ = .203358 and the value LL = -429.5846 (cell G12), is slightly better than the value, LL = -429.5873, calculated previously, as shown in Figure 4.
Examples Workbook
Click here to download the Excel workbook with the examples described on this webpage.
References
Uebersax, J. S. (2015) Introduction to the tetrachoric and polychoric correlation coefficients
http://www.john-uebersax.com/stat/tetra.htm
Microsoft Support (2017) Define and solve a problem using Solver
https://support.microsoft.com/en-us/office/define-and-solve-a-problem-by-using-solver-5d1a388f-079d-43ac-a7eb-f63e45925040

Good afternoon (for my timezone), sir!
I would like to request any recommendable method on how to find the correlation of a 9 x 3 contingency table. My Microsoft Excel license has expired, and I have been using Google Sheets. I cannot find formulae in the Sheets; hence, I am forced to tabulate them and solve them by hand. Do you have any suggestions on how to find the polychoric correlation for such a set of data?
Thank you for your consideration.
The topic is Hand Dominance (so the columns are right, left, and ambidextrous) and Subjects or Courses (English, Mandarin, Filipino, Mathematics, Science, Home Economics, Physical Education, Social Sciences, and Technology) that the respondents believe they excel in.
Hello Vicher,
When you say that you want the polychoric correlation for a 9 x 3 contingency table, do you mean that you want to know the various pairwise correlations or are you looking for something else?
Charles
Sorry for the delayed reply.
Yes, I am looking for pairwise correlations then find summarize the correlations of the table as a whole.
Hello Vicher,
In Excel you can do this (for ordinary correlation) using the Correlation data analysis tool. Using Real Statistics you can do this do this in a number of ways, including via the CORR function as described at
https://real-statistics.com/multiple-regression/least-squares-method-multiple-regression/
If you want to this manually, see the formula under Definition 2 at the above webpage.
Charles
I understand. Thank you so much for the reply! 🙂
Vicher