Worksheet Functions
Real Statistics Functions: The Real Statistics Pack provides the following worksheet functions:
TCORREL(R1, lab, opt, alpha): outputs a column array containing the tetrachoric correlation coefficient for the 2 × 2 contingency table in range R1 (without headings), standard error, z statistic, p-value, and the lower and upper limits of the 1 – alpha confidence interval. If lab = TRUE (default FALSE), then an extra column of labels is appended to the output. If opt = TRUE (default), then method 1 is used; otherwise method 2 is used. alpha defaults to .05.
PolyChorLL(R1, ρ, lo) = LL that corresponds to the data in R1 using the polychoric correlation coefficient ρ. lo is a low value for LL (default is minus one trillion).
For Example 1 of Tetrachoric Correlation Estimation, the output from the array formula =TCORREL(N16:O17,TRUE) is as shown in range R6:R11 of Figure 2 of Tetrachoric Correlation Estimation (using method 1). The output from the array formula =TCORREL(N16:O17,FALSE) is as shown in range R16:R22 of Figure 2 of Tetrachoric Correlation Estimation (using method 2), except that cell R20 is not included.
Data Analysis Tool
Real Statistics Data Analysis Tool: The Real Statistics Resource Pack provides the Polychoric Correlation data analysis tool.
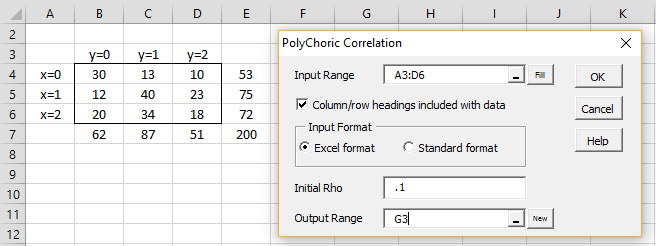
To use this tool for Example 1 of Polychoric Correlation using Solver, press Ctrl-m and select Polychoric Correlation from the menu of choices that appears (or from the Misc tab if using the MultiPage interface). Fill in the dialog box that appears as shown in Figure 1 and press the OK button.
Figure 1 – Polychoric Correlation dialog box
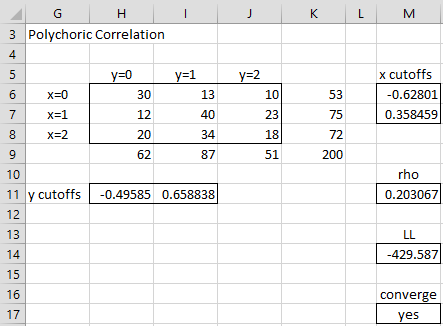
Note that you can insert any value in the Initial Rho field between -1 and 1 (exclusively), except zero. After you click on the OK button, the output shown in Figure 2 appears.
Figure 2 – Real Statistics output
Note that the x and y cutoff values are calculated as in Figure 2 of Polychoric Correlation Basic Concepts. Cell M14 (i.e. LL) contains the formula =PolyChorLL(H6:J8,M11).
Examples Workbook
Click here to download the Excel workbook with the examples described on this webpage.
References
Uebersax, J. S. (2015) Introduction to the tetrachoric and polychoric correlation coefficients
http://www.john-uebersax.com/stat/tetra.htm
Mahler, C.M. (2016) The tetrachoric correlation coefficient
https://eigenblogger.com/tag/tetrachoric-correlation-coefficient/
STATA (2017) Tetrachoric correlations for binary variables
www.stata.com/manuals13/rtetrachoric.pdf


Charles.
Thanks for doing all this. I’m running into a snag with polychoric correlation. I’m using the Polychoric Correlation Tool. When I enter the range, and put in an initial rho of .1, the output uses the rho of .1 rather then computing the rho with the highest maximum likelihood. When I use your data, the same thing happens, so the tool seems to be stuck on whatever value is entered. Do you have any suggestions? Thanks.
Brian,
I just retested the example shown on the website and it works fine. I am not sure what is going wrong in your case. If you send me an Excel file with your analysis I will try to figure out what is going wrong.
Charles
Charles,
Thanks. Since I wrote, I reinstalled RealStats, and everything is fine. Thanks again. I’m having fun with this after a lot of years working with SPSS.
Brian
Hi
It is me again, Ali, we tried your program and I do not know how get correlation matrix in order to do factor analysis. This software only gives Correlation Coefficient.
Thank You,
Ali
daneshmandnet@gmail.com
Ali,
You must use the CORR array function to get the correlation matrix. This is supplied by the Real Statistics software and is not standard Excel. See the following webpage for more information about factor analysis:
Factor Analysis
Charles
Hi
Thank you for grest info on poly. correlation. I have six columns, the first 4, I have either 1, -1, or 0. 1 represent yes, -1 represent “No”, and 0 represent “do not know. Columns 5 and 6 are in Likert (1-5, 1= totally disagree, to 5 = Totally agree).
I did not know what to put for “initial Rho” value. Please advise since I have mixed variable of this type, if Poly Correlation is the correct tool and what should I use for “initial Rho”. On the other hand, I also code my file as just 0=No, 1= Yes, instead of 1 and -1 and ignore all “do not know”. Please let me know what you think.
Best regards,
Ali Daneshmand
daneshmandnet@gmail.com
Ali,
As stated on the referenced webpage, “you can insert any value in the Initial Rho field between -1 and 1 (exclusively), except zero.”
Charles
Thanks for the free software!
Is it accurate to say that the polychoric correlation matrix between non-continuous ordered variables X,Y with values x_1,x_2,,..,x_n ; y_1,..,y_n is equivalent to the Pearson correlation between the underlying latent variables X’,Y’ ?
Yes, this is correct, and is stated on the following webpage
https://real-statistics.com/correlation/polychoric-correlation/polychoric-correlation-basic-concepts/
Charles
Thanks Charles,
Must we have only two latent variables X’,Y’ , or could there be more than two latent variables? I mean, if we had several variables ( which may be reduced to fewer variables through a factor analysis). Could we then have more than two latent variables?
Thanks
The polychoric correlation coefficient is defined for two variables. Just as the Pearson correlation coefficient can be extended to more than two variables, I presume that the same could be done with the polychoric correlation, although I am not aware of how this is done or whether it is done in practice.
Charles