For samples of any given size n it turns out that r is not normally distributed when ρ ≠ 0 (even when the population has a normal distribution), and so we can’t use Property 1 from Correlation Testing via t Test.
There is a simple transformation of r, however, that gets around this problem, and allows us to test whether ρ = ρ0 for some value of ρ0, even for ρ0 ≠ 0.
Fisher Transformation
Definition 1: For any r define the Fisher transformation of r as follows:
![]()
Property 1: If x and y have a joint bivariate normal distribution or n is sufficiently large (via the central limit theorem), then the Fisher transformation r’ of the correlation coefficient r for samples of size n has a normal distribution with mean ρ′ and standard deviation sr′ where
![]()
Corollary 1: Suppose r1 and r2 are as in Property 1 where r1 and r2 are based on independent samples and further suppose that ρ1 = ρ2. If z is defined as follows, then z ~ N(0, 1).
![]()
where

Proof: From Property 1
![]()
for i = 1, 2. By Properties 1 and 2 of Basic Characteristics of the Normal Distribution,
![]()
where s is as defined above. Since ρ1 = ρ2, it follows that 

Excel worksheet functions
Excel Functions: Excel provides the following functions that calculate the Fisher transformation and its inverse.
FISHER(r) = .5 * LN((1 + r) / (1 – r))
FISHERINV(z) = (EXP(2 * z) – 1) / (EXP(2 * z) + 1)
Hypothesis Testing
We can use Property 1 to test the null hypothesis H0: ρ = ρ0. This test is very sensitive to outliers. If outliers are present it may be better to use the Spearman rank correlation test or Kendall’s tau test.
The corollary can be used to test whether two samples are drawn from populations with equal correlations.
Example using Excel functions
Example 1: Suppose we calculate that r = .7 for a sample of size n = 100. Test the following null hypothesis and find the 95% confidence interval.
H0: ρ = .6
Observe that
r′ = FISHER(r) = FISHER(.7) = 0.867
ρ′ = FISHER(ρ) = FISHER(.6) = 0.693
sr′ = 1 / SQRT(n – 3) = 1 / SQRT(100 – 3) = 0.102
Since r′ > ρ′ we are looking at the right tail of a two-tail test
p-value = 2*(1–NORM.DIST(r′, ρ′, sr′, TRUE)) = 2*(1–NORM.DIST(.867, .693, .102, TRUE)) = .0863 > 0.05 = α
r′-crit = NORM.INV(1–α/2, ρ′, sr′) = NORM.INV(.975, .693, .102) = .892 > .867 = r′
In either case, we cannot reject the null hypothesis.
The 95% confidential interval for ρ′ is
r′ ± zcrit ∙ sr′ = 0.867 ± 1.96 ∙ 0.102 = (0.668, 1.066)
Since zcrit = ABS(NORM.S.INV(.025)) = 1.96 the 95% confidence interval for ρ′ is (FISHERINV(0.668), FISHERINV(1.066)) = (.584, .788). Note that .6 lies in this interval, confirming our conclusion not to reject the null hypothesis.
Another example
Example 2: Repeat the analysis of Example 2 of Correlation Testing via t Test using Property 1, this time performing a two-tail test (H0: ρ = 0) using a standard normal test with z = (r′– ρ′) / sr′
r = CORREL(R1, R2) = .564
r′ = FISHER(r) = FISHER(.564) = .639
ρ′ = FISHER(ρ) = FISHER(0) = 0 (based on the null hypothesis)
sr′ = 1 / SQRT(n – 3) = .146
z = (r′ – ρ′) / sr′ = 4.38
Since z > 0, we perform the standard normal test on the right tail:
p-value = 1 – NORM.S.DIST(z, TRUE) = NORM.S.DIST(4.38, TRUE) = 5.9E-06 < 0.025 = α/2
zcrit = NORM.S.INV(1 – α/2) = NORM.S.INV(.975) = 1.96 < 4.38 = zobs
In either case, we reject the null hypothesis (H0: ρ = 0) and conclude there is an association between the variables.
We can also calculate the 95% confidence interval for ρ′ as follows:
r′ ± zcrit ∙ sr′ = .639 ± (1.96)(.146) = (.353, .925)
Using FISHERINV we transform this interval to a 95% confidence interval for ρ:
(FISHERINV(.353), FISHERINV(.925)) = (.339, .728)
Since ρ = 0 is outside this interval, once again we reject the null hypothesis.
We can summarize these steps in Figure 1.
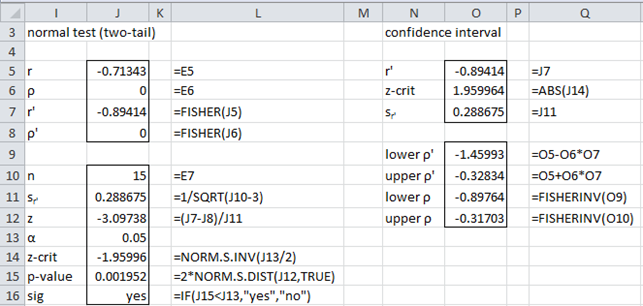
Figure 1 – One sample hypothesis test using a Fisher transformation
Real Statistics worksheet functions
Real Statistics Functions: The following functions are provided in the Real Statistics Resource Pack.
CorrTest(exp, obs, size, tails) = the p-value of the one sample two-tail test of the correlation coefficient using Theorem 2 where exp is the expected population correlation coefficient and obs is the observed correlation coefficient based on a sample of the stated size. If tails = 2 (default) a two-tailed test is employed, while if tails = 1 a one-tailed test is employed.
CorrLower(r, size, alpha) = the lower bound of the 1 – alpha confidence interval of the population correlation coefficient based on a sample correlation coefficient r for a sample of the stated size.
CorrUpper(r, size, alpha) = the upper bound of the 1 – alpha confidence interval of the population correlation coefficient based on a sample correlation coefficient r for a sample of the stated size.
CorrelTest(r, size, rho, alpha, lab, tails): array function which outputs z, p-value, and lower and upper bounds of the 1 – alpha confidence interval, where rho, r, and size are as described above. If lab = True then the output takes the form of a 4 × 2 range with the first column consisting of labels, while if lab = False (default) then the output takes the form of a 4 × 1 range without labels.
CorrelTest(R1, R2, rho, alpha, lab, tails) = CorrelTest(r, size, rho, alpha, lab, tails) where r = CORREL(R1, R2) and size = the common sample size, i.e. the number of pairs from R1 and R2 for which both pair members contain numeric data; i.e. COUNTPair(R1, R2, FALSE).
If alpha is omitted it defaults to .05. If tails = 2 (default) a two-tailed test is employed, while if tails = 1 a one-tailed test is employed.
Examples using Real Statistics functions
For Example 1, CorrTest(.6, .7, 100) = .0864, CorrLower(.7, 100) = .584 and CorrLower(.7, 100) = .788. Also =CorrelTest(.7, 100, .6, 100, .05, TRUE) generates the output displayed in Figure 2.
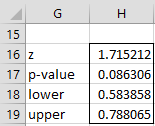
Figure 2 – CorrelTest output
Example 3: Test whether the correlation coefficient for the samples in ranges K12:K18 and L12:L18 of the worksheet in Figure 3 is significantly different from .9.

Figure 3 – Hypothesis testing of the correlation coefficient
We calculate the correlation coefficient for the two samples to be .975 (cell O12) using the formula =CORREL(K12:K18,L12:L18). The two-tailed test is shown in range N14:O17 via the array formula =CorrelTest(K12:K18,L12:L18,0.9,0.05,TRUE). Since p-value = .15 > .05 = α, we cannot reject the null hypothesis that the data is taken from a population with correlation .9.
Examples Workbook
Click here to download the Excel workbook with the examples described on this webpage.
References
Howell, D. C. (2010) Statistical methods for psychology (7th ed.). Wadsworth, Cengage Learning.
https://labs.la.utexas.edu/gilden/files/2016/05/Statistics-Text.pdf
OpenStax (2023) Testing the significance of the correlation coefficient
https://stats.libretexts.org/Bookshelves/Introductory_Statistics/Introductory_Statistics_(OpenStax)/12%3A_Linear_Regression_and_Correlation/12.05%3A_Testing_the_Significance_of_the_Correlation_Coefficient
Hello,
Thanks for this website. I have a few questions. I want to check if my understanding of inference of Pearson correlation is right.
First, we can use t statistic to calculate p-value, but this needs data to be bivariate normally distributed, you mentioned in another post that we can check normality for both variables, but I read that tests like Marida’s test can check for bivariate normality which is different from checking for univariate normality for each variable. Also, I read in some sources that it needs also homogeneity of variance assumption. I don’t know from which this assumption come, may be bivariate normality assumes both univariate normality and homogeneity of variance? or it is not an assumption? Or checking for univariate normality for both variables will be fairly enough?
Second, if the data is skewed or variances are heterogenous (if it is an assumption!) but large enough, can I use t statistic under the central limit theorem to calculate p-value? If yes, which will be better t statistic or Fisher Transformation? Should I also try to calculate Kindel tau or spearman, will they give different P-values from Pearson correlation in case of non-normal data?
Sorry for any stupid questions, I am a beginner and still learning about statistics.
Hello Noor,
You are, in fact, asking excellent questions.
1. Generally, the test is pretty robust to violations of bivariate normality, but you can perform Mardia’s test as described at
https://real-statistics.com/multivariate-statistics/multivariate-normal-distribution/multivariate-normality-testing/
Actually, the website provides two other tests for bivariate normality. See
https://real-statistics.com/multivariate-statistics/multivariate-normal-distribution/multivariate-normality-testing-frsj/
https://real-statistics.com/non-parametric-tests/goodness-of-fit-tests/goodness-of-fit-tests-characteristic-function/gof-icf-multivariate-normal-distribution/
Usually it is sufficient to check for univariate normality for both variables (or just check the chart of the scatter points for a ellipse shape). For a large sample, the central limit theorem should hold (but not always).
2. Homogeneity of variances is an assumption. This is the same assumption as required for linear regression. See the following webpage:
https://real-statistics.com/multiple-regression/heteroskedasticity/
Note too that this correlation test is equivalent to a t-test for two independent samples, as described at
https://real-statistics.com/correlation/dichotomous-variables-t-test/
Thus, you can use the unequal variance version of the test if necessary
3. The most important assumptions for this test are: (a) you are testing rho = 0 (and not rho = r where r is not zero, and (b) the data is reasonably linear.
4. If you are really concerned about the assumptions you can use resampling, as described at
https://real-statistics.com/correlation/resampling-correlation/
Charles
Thanks! Your explanation is great!
+You probably mean Homogeneity of variances in point 2
Noor,
Glad I could help.
Yes, you are correct. I just changed my response (for other people) to “homogeneity”. Thanks for the correction.
Charles
One last question, does Fisher transformation also assume Homogeneity of variances ?
Hello Noor,
I have not seen an explicit requirement for homogeneity of variances, but it may indeed be an issue. TAlthough I don’t believe that it addresses homogeneity of variance directly, the following article may be helpful.
https://link.springer.com/article/10.3758/s13428-016-0702-8
You can use the bootstrapping approach and see whether it agrees with the Fisher transformation approach when the variances are clearly unequal.
Charles
Good day, please, can I use Fisher’s Z to determine difference in influence of a variable on another variable after I have used one-sample t-test to determine the influence of the variable on the other?
Hello,
I don’t completely understand what you are trying to do. Can you provide some more details?
Charles
Hello Charles
Could you show how to compute power for the above examples?
Regards
António
Hello Antonio,
See https://www.real-statistics.com/correlation/one-sample-hypothesis-testing-correlation/power-sample-size-correlation-testing/
Charles
Dear Dr. Zaiontz,
have I understood correctly, that the Fisher’s z-Test to compare two Pearson correlation coefficients makes the same assumptions as the Pearson correlation itself? That is, if in two independent samples variables x and y are interval scale, they are both normally distributed and their association is linear, then that is sufficient to compare the two Pearson correlations coefficients using Fisher’s z-Test?
Thanks a lot for this open access website!
Best regards
David
Dear David,
Pearson’s correlation is not a test, and so there are no assumptions. It should only be used when the association is linear, although there is nothing to stop you from calculating the correlation coefficient even if the two variables don’t have a linear relationship.
The assumptions for the test using Fisher’s transformation that you have stated are correct.
Charles
Hi Charlie,
(1) There seems to be two ways to test whether a Pearson correlation is significantly different from zero, one using Fisher transformation and the other one using t-test. Do these two tests always lead to the same conclusion? Which test is preferred?
(2) If I measured two variables among n subjects, and computed Pearson correlation for each subjects. Thus, I ended up with n rho(s). Is there way to test whether these rho(s) are different from zero?
Hello Hong Lu,
(1) These tests probably give similar results, but not necessarily identical results. I suggest that you use both tests and see for yourself what the differences are. The t-test is only for testing vs zero, while the Fisher test can be used to test against any value. Probably the t-test is a better choice.
(2) Are you trying to test whether all n values of rho are zero?
Charles
Say if I have 10 subjects, I then have 10 rho values. The idea is that these ten rho values are ten samples from a population, and I want to know whether the population mean (the true correlation between these two variables) is different from zero.
Why do 10 subjects result in 10 rho values? If you are creating pairwise rho values, you would have C(10,2) = 45 rho values.
Charles
There are two variables I’m interested in. Within each subject, I measured these two variables multiple times, and then for each subject, I correlated these two variables, resulting in one rho value per subject.
For each subject, the values for each of the two variables are not random, and so I don’t know how to test the rho value. I would assume that the rho values would be closer to 1 than 0, but I am not sure about this.
Charles
Hello Charles
Thank you for good explanation.
I have a question.
To test whether correlation from 2 exclusive sample is same or not.
1. If I only know sample correlation (r) then, how can I test?
-> Using whole sample correlation assumes as a population correlation?
and randomly subsampling to calculate sample correlation
2. I want to test difference of correlation, then
z=(r1`-r2`)/s, s=sqrt(1/(n1-3)+1/(n2-3)),
r1′ = FISHER(r1), r2′ = FISHER(r2)
* FISHER(r) = .5 * LN((1 + r) / (1 – r)) ?
Thank you
sincerely
Hello,
1. If you are referring to two pairs of samples, then see the following webpage
https://real-statistics.com/correlation/two-sample-hypothesis-testing-correlation/
2. If I understand what you are saying, then again see the above webpage.
Charles
Hello Charles,
For the Example 1, CorrTest(.6, .7, 100), p-val. = .0864, is insignificant, which is a two-tailed test. But, for the one-tailed test, p-val. = .043, is significant.
The two tail test is showing that the .6 is no different than .7; but the one-tail test is showing that the two scores differ.
How can both of the above be true?
Hello Gagandeep,
1. That “CorrTest(.6, .7, 100), p-val. = .0864, is insignificant” doesn’t show that “.6 is no different than .7”. The sample correlation is clearly .6 and we all know that .6 is not the same at .7. What we are trying to understand is the possible value of the population correlation. p-value = .0864 tells us that we don’t have enough evidence (from the sample) that the population correlation is not .7 (or close to .7).
Since we don’t know a priori whether the population is higher or lower than .6, we usually need to use the two-tailed test (and conclude that we don-t have sufficient evidence to reject the null hypothesis that the population correlation is .7). If, however, we knew in advance of running our experiement (from previous experiments based on theoretical considerations) that the population correlation couldn’t be a valur larger than .7, then, based on the one-tailed test, we could conclude that that we have significant evidence for concluding that the population correlation is less than .7. Since we rarely have this sort of advanced knowledge, we usually run a two-tailed test instead of a one-tailed test.
It is always easier to get a significant result (i.e. one that contradicts the null hypothesis) using a one-tailed test rather than a two-tailed test.
Charles
Hello Charles,
Thank you for this post and Happy New Year to you. From your post it appears that you can easily test H0: p1 – p2 = 0, because as you say p1=p2 implies p1’=p2′ and vice versa. Suppose I am interested to test H0: p1 – p2 = c where c is non-zero. Would this be possible using Fisher transformation or any other method you may know?
Thank you,
Simeon
Hello Simeon,
From your question it seems like you are trying to compare two correlation coefficients. If so, see the following webpage:
https://real-statistics.com/correlation/two-sample-hypothesis-testing-correlation/
Charles
Can I use Fisher r to z to compare the main effect of multilinear regression? In this case I’d use the observe R for the independent models I am comparing. The F test to compare R^2 requires data not usually reported in my field but R and N always are.
Joe,
I don’t understand your question.
1. By “multilinear regression” do you mean “multiple linear regression”?
2. I can’t understand what main effects you are trying to compare.
3. The standard regression analysis reports the R^2 and F values, as well as a p-value. Not clear why you would want to use Fisher’s r to z.
Charles
how can we take care when hypothesis is rho =1
Anuj,
It’s a good question since the Fisher test doesn’t work in this case. The best I can think of at this moment is to test instead for a value just under one; e.g. rho = .99.
Charles
Hey Charles,
For Example 2, why is alpha divided by 2 to determine the significance of the p-value? Is it because of the one-tailed test? In the event of a two-tailed test, would you leave the alpha as is?
Thanks.
After a bit more research, it seems like one-tailed tests use the alpha as is, while the two-tailed tests use alpha/2. If that is the case, you may need to change the way you calculated the z-crit value in Example 2.
David,
I believe that I have calculated the z-crit value correctly, using alpha/2.
Charles