Basic Concepts
Goodman and Kruskal’s gamma statistic is a measure of (symmetric) association between two ordinal variables. Gamma takes values between -1 and 1. A value of 1 or -1 means that the variables have a perfect association: +1 when the relationship is positive and -1 when the relationship is negative. A value of 0 means that there is no relationship between the variables.
Definitions
The data must take ordinal values. Gamma is calculated in a manner similar to Kendall’s tau, where C = # of concordant pairs and D = # of discordant pairs, via
![]()
Gamma can be viewed as a replacement for Kendall’s tau (in the two variables) with lots of ties (indicated by the frequencies).
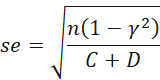
The standard error for gamma is
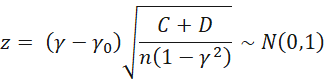
You can test the hypothesis that γ = γ0 via
A confidence interval for γ is
γ ± se ⋅ zcrit
where zcrit = NORM.S.DIST(1-α/2,TRUE).
Interpretation
We can interpret the strength of the association as follows: γ = 0.00: no association, ±.01-.09: weak association, ±.10-.29: moderate association, ±.30-.99: strong association, ±1.00: perfect association.
Example
Example 1: Determine the gamma measure of association between the variable body type (rows) and satisfaction with an ad campaign (columns) based on the contingency table in Figure 1.
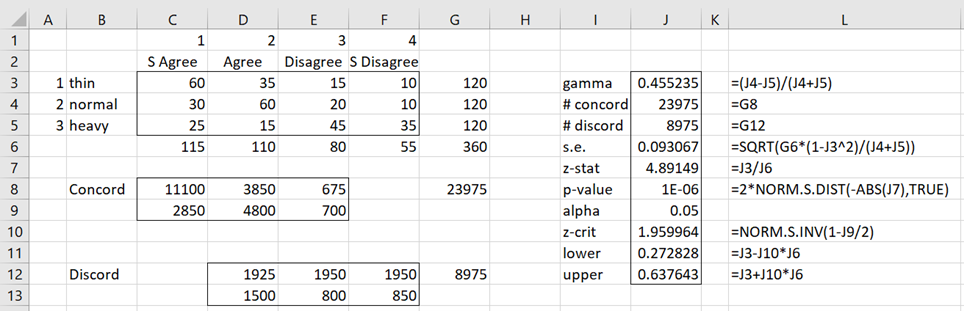
Figure 1 – Gamma statistic
We calculate the C (# of concordance pairs) in cell G8 via the formula =SUM(C8:E9). We can calculate the values in C8:E9 by placing the formula
=C3*SUM(SUBMATRIX($C$3:$F$5,$A3+1,C$1+1))
in cell C8, highlighting range C8:E9, and pressing Ctrl-R and Ctrl-D. Here, SUBMATRIX is a Real Statistics function that extracts a subrange from a given range as described in Reformatting Capabilities.
We calculate the D (# of discordance pairs) in cell G12 via the formula =SUM(D12:F13). The values in D12:F13 are calculated by placing the formula
=D3*SUM(SUBMATRIX($C$3:$F$5,$A3+1,1,$A$5-$A3,D$1-1))
in cell D12, highlighting range D12:F13, and pressing Ctrl-R and Ctrl-D.
The calculation of gamma and the test as to whether this measure is significantly different from zero is shown on the right side of Figure 1. From cell J3 we see that γ =.4552. From cell J8, we see that gamma is significantly different from zero. Also, the 95% confidence interval for gamma is (.2728, .6376).
Worksheet Functions
Real Statistics Functions: The Real Statistics Resource Pack provides the following function for R1 that contains a contingency table (without headings or totals).
GAMMA_TEST(R1, lab, alpha, gamma0): returns a column array with gamma, # of concordance pairs, # of discordance pairs, standard error, z-statistic, p-value, and the lower and upper ends of the 1-alpha confidence interval for gamma.
If lab = TRUE (default FALSE), then an extra column of labels is appended to the output. alpha is the significance level (default .05). The z-statistic is equal to (gamma – gamma0)/s.e. If gamma0 is omitted, it defaults to zero. Note that the confidence interval is based on gamma0 = 0 even when gamma0 is specified.
For Example 1, the formula =GAMMA_TEST(C3:F5,TRUE) produces the output shown in the upper part of Figure 2.
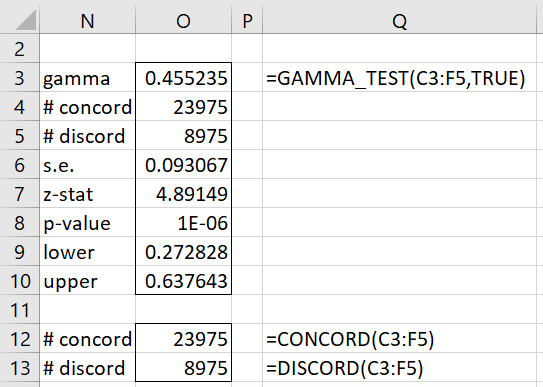
Figure 2 – Real Statistics worksheet functions
The Real Statistics Resource Pack also provides the following worksheet functions.
CONCORD(R1) = # of concordance pairs based on the contingency table in R1.
DISCORD(R1) = # of discordance pairs based on the contingency table in R1.
Data Analysis Tool
Real Statistics Data Analysis Tool: The Real Statistics Resource Pack provides the Association Tests data analysis tool that can be used to calculate the gamma statistic, and can be used to test whether γ = γ0.
This is done in a manner similar to that shown in Lambda Coefficient (except that the Gamma option is chosen instead of the Lambda option).
Examples Workbook
Click here to download the Excel workbook with the examples described on this webpage.
References
Wikipedia (2023) Goodman and Kruskal’s gamma
https://en.wikipedia.org/wiki/Goodman_and_Kruskal%27s_gamma
Sheskin, D. (2000) Handbook of parametric and nonparametric statistical procedures. 2nd ed. Chapman & Hall/CRC
Dee Britton (2023) SPSS eTutor: Measures of association and correlation. SUNY Empire
https://subjectguides.sunyempire.edu/c.php?g=659059&p=4626955#:~:text=Gamma%20is%20a%20measure%20of,perfect%20relationship%20between%20those%20variables