Basic Concepts
We seek a transformation of data in a sample x1, …, xn which results in data that is normally distributed.
If one of the sample values is not positive, then we add 1–a to all the sample values where a is the smallest sample value. This will transform the sample into only positive values. Next, we sort the sample into ascending order, and so assume that x1 ≤ … ≤ xn. We now define the Box-Cox transformation y1, …, yn for any value of λ ≠ 0
We could also define the transformation at λ = 0, but because
this is not necessary. In fact, if in the optimization process described below, we get a value of λ close to zero, we will generally use the value λ = 0 to get a ln transformation.
We now use the approach described in Graphical Tests for Normality to create QQ plots by defining a sequence z1, …, zn where
and Φ-1 is the inverse of the standard normal distribution, i.e. Φ-1(p) = NORM.S.INV(p).
Finally, we use Excel’s Goal Seek to find the value of λ which maximizes the correlation coefficient between the y and z values.
Example
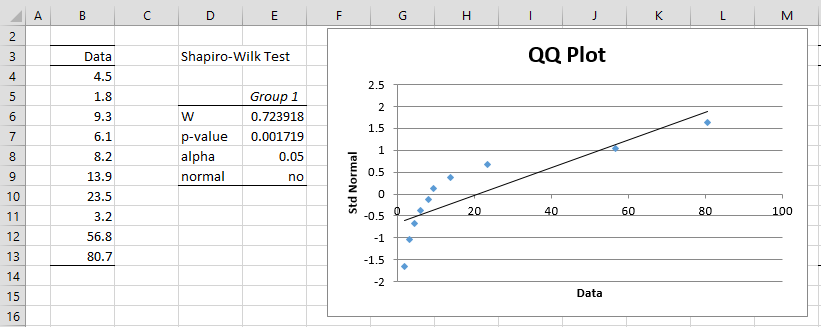
Example 1: Find the Box-Cox transformation which best normalizes the data in range B4:B13 of Figure 1.
Figure 1 – Non-normal data
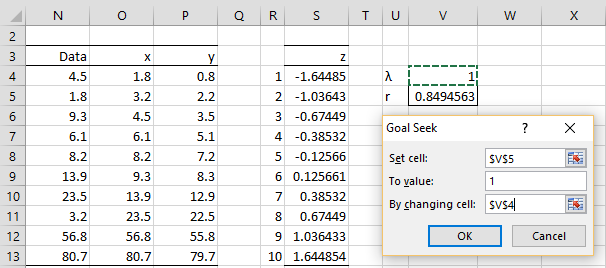
As we can see from the QQ plot and the results of the Shapiro-Wilk test, this data is not normal. We now create the x, y and z values for the data, as described above. This is shown in Figure 2.
Figure 2 – Set up for Goal Seek
Here, column O consists of the data in sorted order, e.g. by using the formula =QSORT(N4:N13), and column P contains the transformed data, e.g. cell P4 contains the formula =(O4^V$4-1)/V$4 or optionally =IF(V4=0,LN(O4),(O4^V$4-1)/V$4). Column S consists of the inverse normal values, and so cell S4 contains the formula =NORM.S.INV((R4-0.5)/R$13). Finally, cell V4 contains a guess for the λ value and cell V5 contains the formula =CORREL(P4:P13,S4:S13) to calculate the correlation coefficient between the y and z values.
Goal Seek
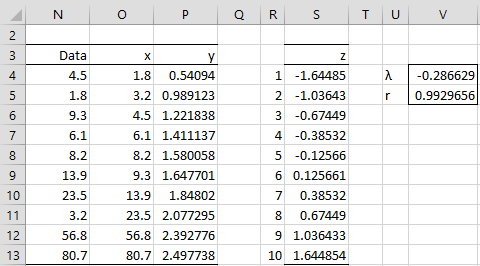
We now select Data > Forecast|What If Analysis > Goal Seek (or Data > Data Tools|What If Analysis > Goal Seek for versions of Excel prior to Excel 2016). Next, we fill in the dialog box that appears with the values shown on the right side of Figure 2 and press the OK button. The result is that the value for λ converges to -0.286629.
Figure 3 – Goal Seek output
Figure 3 contains the results of the Shapiro-Wilk test and QQ plot on the transformed data in column P of Figure 2. As you can see, the transformed data is normally distributed.
Figure 4 – Testing normality for transformed data
Actually the value λ = -0.216 yields a slightly better correlation, namely r = .9937987, but the normality testing is not much different for this transformation.
Another approach to optimizing the value of lambda is to maximize the log-likelihood function, which in this case is
where s2 = the population variance of the transformed xi values, as calculated using the VAR.P(R1) function in Excel. The value of LL can be maximized using Goal Seek or using the golden search algorithm. The Real Statistics Resource Pack has implemented this approach as described in Example 2.
Worksheet Functions
Real Statistics Functions: The Real Statistics Resource Pack provides the following functions:
BOXCOX(R1, λ): array function which returns a range containing the Box-Cox transformation of the data in range R1 using the given lambda value. If the lambda argument is omitted, then the transformation which best normalizes the data in R1 is used, based on maximizing the log-likelihood function.
BOXCOXLL(R1, λ) = log likelihood function of the Box-Cox transformation of the data in R1 using the given lambda value
BOXCOXLambda(R1) = the value of lambda which maximizes the log likelihood function of the Box-Cox transformation of the data in R1
Example
Example 2: Repeat Example 1 using the Real Statistics functions
We begin by displaying the Box-Cox transformation for values of lambda between -2 and 2, as shown in Figure 5. E.g. the transform of the data element when λ = -2 are shown in the range D4:D13, as calculated by the array formula =BOXCOX($B$4:$B$13,D3).
The LL value when λ = -2 is -398802 (cell D14), as calculated by the formula =BOXCOXLL($B$4:$B$13,D3). Alternatively, we could use the formula
=- COUNT(B4:B13)/2*LN(VARP(D4:D13))+(D3-1)*SUMPRODUCT(LN(B4:B13))
We see from Figure 5 that the maximum value of LL occurs somewhere between λ = -.5 and λ = 0. We can make successive guesses to eventually find a value sufficiently close to the value of λ that maximizes LL sufficiently well for our needs. Essentially this is what the BOXCOXLambda function does.
Figure 5 – Box-Cox optimization
In fact, we see that =BOXCOXLambda(B4:B13) = -0.16394 (cell N3) provides this value of lambda, corresponding to LL = -24.8913 (cell N14). The transformation values are shown in range N4:N13, as calculated by the array function =BOXCOX(B4:B13), which is equivalent to the array function =BOXCOX(B4:B13, N3).
Finally, we note that the optimal value λ = -0.286629 that we found in Example 1 yields an LL value which is almost as good (LL = -24.9853), but the LL value for λ = -0.16394 is slightly better.
Examples Workbook
Click here to download the Excel workbook with the examples described on this webpage.
Reference
Li, P. (2005) Box-Cox transformations: an overview
https://www.ime.usp.br/~abe/lista/pdfm9cJKUmFZp.pdf


Hello Charles,
What is the best way to deal with a dataset which is extremely skewed and with negative values? Is “shifting” the data by the amount of the lowest value+1 an option?
For instance, if the smallest value is -1000, is adding 1001 to every single data point in the dataset a valid method? Do we need to correct for that afterwards?
I think your formula of LL is wrong or the example solved is wrong … about Sumatory (epsilon), and Productory (Pi) … or the example is wrong applied? … why use sumproduct command if the formula is sumatory?
Hello Jesus,
SUMPRODUCT can be used in place of SUM. Its advantage is that you can press Enter and don’t need to press Ctrl-Shft-Enter in many situations.
What is wrong with the formula (or example)? Did you get a different result from another source? If so, can you tell me the details?
Charles
Hello sir,
I have been using Office Excel 365 with this add-in. however while all other functions work well, I could not locate the box-cox transformation function.
I downloaded and installed the latest real stat pack.
I am having trouble with a data set that is non-normally distributed. I used box-cox with another software however the resulting data is still not normally distributed.
can you advised me with this?
Hello Gerald,
The BOXCOX function should be available in any of the latest Real Statistics releases. It is not a data analysis tool, but there is the BOXCOX function, which you use like any other Excel function.
Charles
Hello hope all is well
I am attempting to find a suitable turnaround time for my lab. I looked at testing data from 2 years, calculated Q1 and Q3 and IQR, and identified outliers. I then used excel to get the distribution and z-scores. My plot looks like a bell curve, but the mean is 43, median 39 and mode 36, and the curve has a right tail.
This data is right skewed because of lower bound data.
How can I “normalize” this data in an attempt to obtain an average TAT
thanks
Hello,
I can’t say for sure, but did you try using a Box-Cox normal transformation as described on this webpage?
Charles
I am confused about the idea behind the normality transformation operation, If the data appears as non -normality, the transformed data can well represent the original ones? the inferences we made according to the transformed data is still meaningful?
Hi Emma,
Often data are transformed to satisfy the assumptions of the statistical test being used. As you correctly say, the test now applies to the transformed data, and so the results of the test may or may not be meaningful for the original data. The good news is that often it is meaningful, although you are correct to be concerned since “often” doesn’t mean “always”. Whether the test is meaningful depends on the specific test and data.
Charles
Thanks Charles,
This article was very helpful!
Although I took a slightly different approach. I used the Solver plug-in in Excel and solved for lambda so that the skewness was equal to zero. This gave me a perfectly symmetrical distribution and a Q-Q plot correlation of 1.000.
David,
That seems like an interesting approach, which may be sufficient for your needs. It doesn’t necessarily ensure that kurtosis will be zero (a further requirement for normality), although you should be able to modify your approach to obtain this as well.
I am curious to know how similar or different is the value you obtained for lambda from the one selected by Real Statistics. Also what was the kurtosis for the transformed data?
Charles
Charles, this webpage has been really helpful for another data set, so thank you in advance; however, I have a data set that has 20 of 67 data points with zeroes. The transformation does not appear to be optimized, as the transformation result (Y) is 20 numbers with the same value (-1.207401), resulting in a skewed distribution with a Shapiro-Wilk test W= 0.903332 and p-value <0.0001. Any suggestions on how to proceed?
Arby,
You may not be able to normalize your data via a transformation.
What hypothesis are you trying to test? Perhaps you can use a nonparametric test.
Charles
I have some data points that are zeroes… how do I work around this?
Lindsey,
This is answered in the second paragraph of the webpage. If you don’t have any negative values, just add one to every data value, and then apply the transformation.
Charles
Could you clarify: is the “y” or “z” column the transformed data?
Lindsey,
Column y contains the transformed data
Charles