Basic Approach
Given two samples x1, …, xn and y1, …, yn, we seek a transformation z1, …, zn of the y values so that the x and z values are as close to linear as possible; i.e. the points (x1, z1), …, (xn, zn) more or less form a straight line.
The approach we take is to find z1, …, zn using a Box-Cox transformation, where we choose λ so that the correlation between the x and z values is as close to 1 as possible. In particular, we use Excel’s Goal Seek to maximize the correlation coefficient.
Example
Example 1: Make a Box-Cox transformation z of the y data in Figure 1 so that the x and z data are as close to linear as possible.
Figure 1 – Scatter plot
We see from the scatter diagram displayed on the right side of Figure 1 that the (xi, yi) values are far from linear.
We define the Box-Cox transformation z1, …, zn for any value of λ by
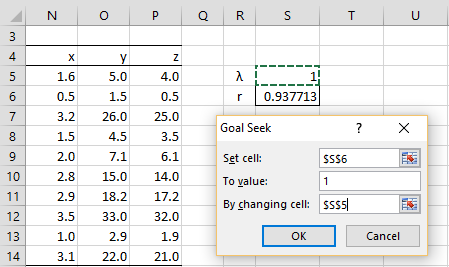
We implement this as shown in Figure 2.
Figure 2 – Initialization of Goal Seek
Here, column P contains the transformed data, e.g. cell P5 contains the formula =IF(S$5<>0,(O5^S$5-1)/S$5,LN(O5)), cell S5 contains a guess for the λ value and cell S6 contains the formula =CORREL(N5:N14,P5:P14) to calculate the correlation coefficient between the y and z values.
Goal Seek
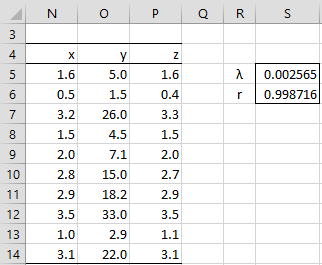
We now select Data > Data Tools|What-If Analysis > Goal Seek (or Data > Data Tools|What If Analysis > Goal Seek for versions of Excel prior to Excel 2016). Next, we fill in the dialog box that appears with the values shown on the right side of Figure 2 and press the OK button. The result is that the value for λ converges to .002565.
Figure 3 – Goal Seek output
We see that this value of λ transforms the y values into z values which forms a near linear relationship with the x values; in fact, these are aligned with the straight line z = x.
It is common to round λ off to the nearest integer or reciprocal of an integer (especially -2, -1.5, -1, -.5, 0, .5, 1, 1.5, 2).
For Example 1, since λ is near 0, we can use the transformation z = ln y instead of
This is a consequence of the fact that
Alternative Approach
Another version of the Box-Cox transformation is given by
![]()
![]()
where ỹ is the geometric mean of the y + a values, i.e.
This has the advantage that the standard deviation of the z values is approximately equal to the standard deviation of the y values (for any value of λ).
Examples Workbook
Click here to download the Excel workbook with the examples described on this webpage.
Reference
Li, P. (2005) Box-Cox transformations: an overview
https://www.ime.usp.br/~abe/lista/pdfm9cJKUmFZp.pdf


after contact transformation of data
how can record my results in form of raw data or transform data
Ahmed,
I am not sure that I understand your question, but perhaps the answer is that you use a inverse transformation.
Charles