Basic Concepts
Property 1: If we draw two independent samples of size n1 and n2 with sample variances s12 and s22 from two normal populations with corresponding population variances σ12 and σ22, then
where F+crit is the right critical value of F(n2–1, n1–1) and F–crit is the left critical value; i.e. F+crit = F.INV.RT(α/2, n2–1, n1–1) and F–crit = F.INV(α/2, n2–1, n1–1).
Proof: By Property 7 of Chi-square Distribution
By Definition 1 of F Distribution
from which it follows that
or equivalently
which means that
where F′+crit is the right critical value of F(n1–1, n2–1) and F′–crit is the left critical value. This completes the proof.
Conclusion
Since, F.INV(α, df1, df2) = 1/F.INV.RT(α, df2, df1), we can express the confidence interval by
We can now use this property to calculate the confidence interval for the ratio of variances.
Example
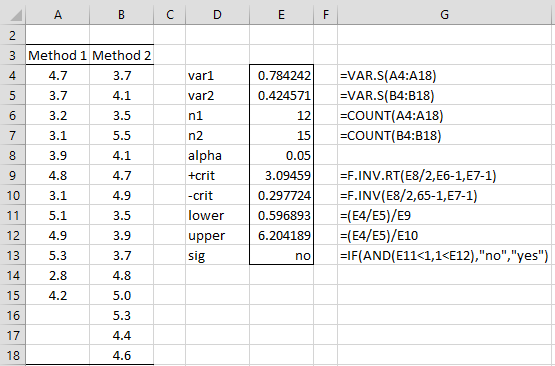
Example 1: Calculate a 95% confidence interval for the ratio of (population) variances based on the data from Example 1 of Two Sample Hypothesis Testing of the Variance.
The calculation of the confidence interval is shown in Figure 1.
Figure 1 – Confidence interval for variance ratio
A ratio of 1 means that the two population variances are equal. Since 1 is in the confidence interval (.597, 6.204), once again we have a non-significant result; i.e. we cannot conclude that the two population variances are different.
Examples Workbook
Click here to download the Excel workbook with the examples described on this webpage.
References
PennState (2023) Confidence intervals for variances. Introduction to Mathematical Statistics
https://online.stat.psu.edu/stat415/book/export/html/810
Srivatsan, R. (2020) Confidence interval for the ratio of population variances. CountBio
http://www.countbio.com/web_pages/left_object/R_for_biology/R_biostatistics_part-1/confidence_interval_variance_ratio.html
Watts, V. (2022) Statistical inference for two population variances
https://ecampusontario.pressbooks.pub/introstats/chapter/11-3-statistical-inference-for-two-population-variances/


