Data Analysis Tool
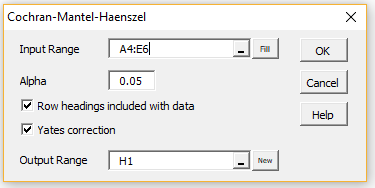
Real Statistics Data Analysis Tool: The Cochran-Mantel-Haenszel data analysis tool can be used to obtain the results for Example 1 of CMH Example. To use this tool for Example 1 press Ctrl-m and select the Cochran-Mantel-Haenszel option from the Misc tab. Fill in the dialog box that appears as shown in Figure 1.
Figure 1 – CMH dialog box
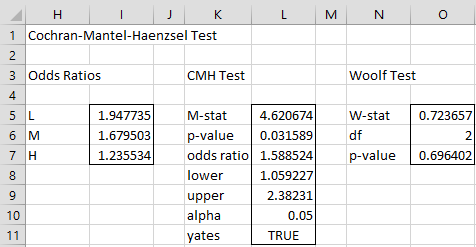
After pressing the OK button, the output shown in Figure 2 is displayed.
Figure 2 – CMH data analysis
Worksheet Functions
Real Statistics Functions: The data analysis tool calls the following two array functions that are provided in the Real Statistics Resource Pack. In the following R1 is the input data array (without headings). For Example 1, R1 is the range B4:E6 shown in Figure 3.
CMHTest(R1, lab, yates, alpha): returns a column range with the values M, p-value, r, lower and upper for the CMH test, where alpha is the significance level (default .05) and yates = TRUE (default) if the continuity correction is used; if lab = TRUE an extra column is appended with labels (default = FALSE).
WoolfTest(R1, lab): returns a column range with the values W, df, p-value for the Woolf’s heterogeneity test; lab is as for CMHTest.
For example, the output from =CMHTest(B4:E6,TRUE) is shown in range K5:L9 of Figure 2 and the output from =WoolfTest(B4:E6,TRUE) is shown in range N5:O7.
Examples Workbook
Click here to download the Excel workbook with the examples described on this webpage.
References
PennState (2017) Cochran-Mantel-Haenszel test
https://online.stat.psu.edu/stat504/Lesson04#mantel-haenszel-test-for-linear-trend
SAS Help Center (2019) Cochran-Mantel-Haenszel statistics
https://documentation.sas.com/doc/en/statug/14.2/statug_freq_details86.htm
Moral de la Rubia, J., Valle de la O, A. (2023) Everything you wanted to know but could never find from the Cochran-Mantel-Haenszel test
https://www.scirp.org/pdf/jdaip_2023082810224634.pdf

