Worksheet Function
Real Statistics Function: The Real Statistics Resource Pack supplies the following function:
PropCI(p, n, lab, type, alpha): returns a column array with the lower and upper limits of the 1-alpha confidence interval for the proportion p based on a sample of size n; type = the type of the confidence interval with 0 = Wilson score (default), 1 = Agresti-Coull, 2 = Cooper-Pearson, 3 = Wald; default for alpha is .05; if lab = TRUE (default FALSE) an extra column of labels is appended to the output.
For example, if you place the array formula =PropCI(.3, 50, TRUE, 0, .05) in range A11:B12 of Figure 1 in Proportion Parameter Confidence Interval, the resulting values would be the same as those displayed in the figure.
Data Analysis Tool
Real Statistics Data Analysis Tool: The Real Statistics Resource Pack supplies the One-Sample Proportion Test and Two-Sample Proportion Test data analysis tools.
One-sample Example
Example 1: Use the One-Sample Proportion Test data analysis tool to determine whether the AIDS drug in Example 1 of Proportion Parameter Confidence Interval cures at least 50% of the patients. In this case, we want to test the null hypothesis π ≥ .5 (i.e. the population proportion is at least 50%) vs. the alternative hypothesis π < .5.
To accomplish this, press Ctrl-m and choose the One-Sample Proportion Test option from the Misc tab. Now, fill in the dialog box that is displayed as shown in Figure 1.
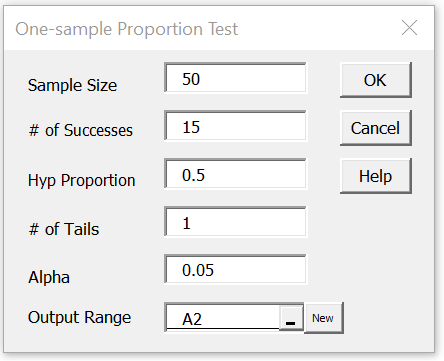
Figure 1 – One-sample Proportion Test dialog box
After clicking on the OK button, the output shown on the left side of Figure 2 is displayed. Column D displays the formulas used in column B.
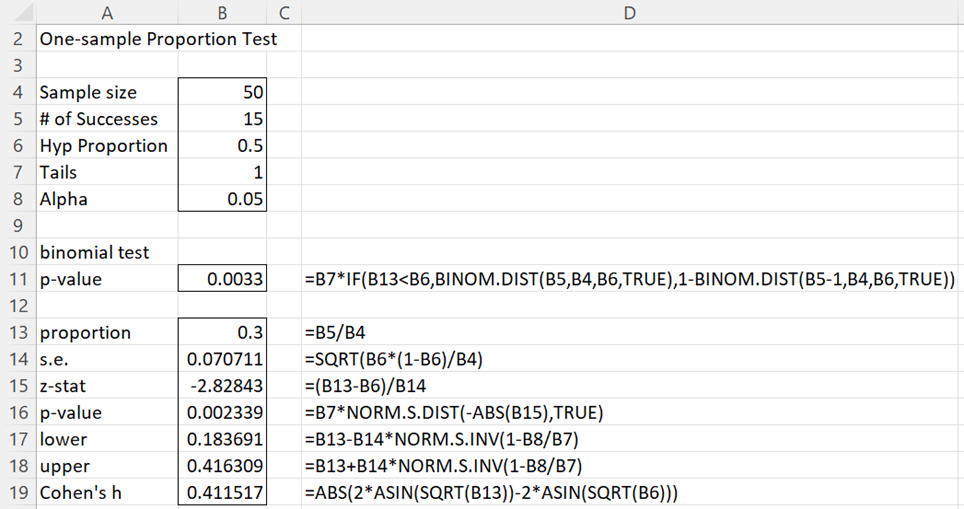
Figure 2 – Output from One-sample Proportion Test
The p-value of either of the two tests is less than .05 (cells B11 and B16) and so we have a significant result. We conclude there is evidence to support the alternative hypothesis that less than 50% of the patients are cured.
Since this is a test of the left tail (observed proportion = .3 < .5 = hypothetical proportion), we also see (from cell B18) that the 95% confidence interval for the cure rate is (-∞, .416). Since this interval doesn’t contain .5, we again conclude that we have a significant result. Note that the value in cell B17 would have been used if the observed proportion were larger than the hypothetical proportion. In this case the confidence interval would have been (.184, ∞).
Finally note that Cohen’s h = .412, a little less than a medium effect.
Two-tailed test
If we had run a two-tailed test (null hypothesis π = .5), then the results would be as shown in Figure 3. Note that we obtain the same results if we simply change the value in cell B7 from 1 to 2.
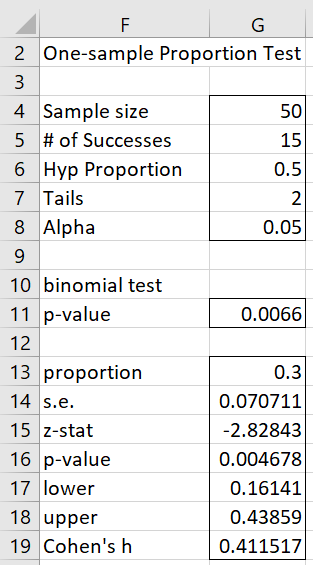
Figure 3 – Two-tailed test
This time the 95% confidence interval is (.161, .438). Note that this is the Wald interval. To obtain the other confidence intervals, you need to use the PropCI function as described above.
Two-sample Example
Example 2: Use the Two-Sample Proportion Test data analysis tool to obtain the results for Example 1 of Two-sample Proportion Testing.
Press Ctrl-m and choose the Two-Sample Proportion Test option from the Misc tab on the dialog that is displayed. Now, fill in the dialog box that is displayed as shown in Figure 4.
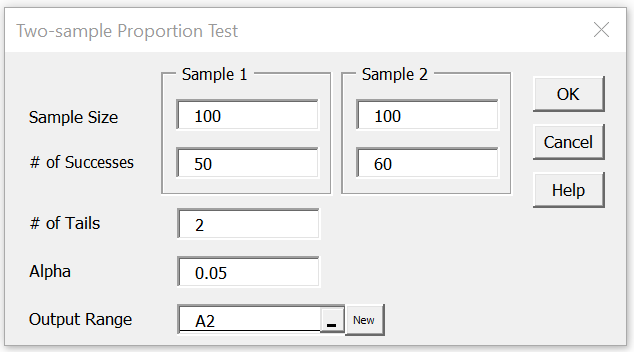
Figure 4 – Two-sample Proportion Test dialog box
Upon clicking on the OK button, the results shown in Figure 5 appear (although the values in column D have been added so that you can see the formulas in column B).
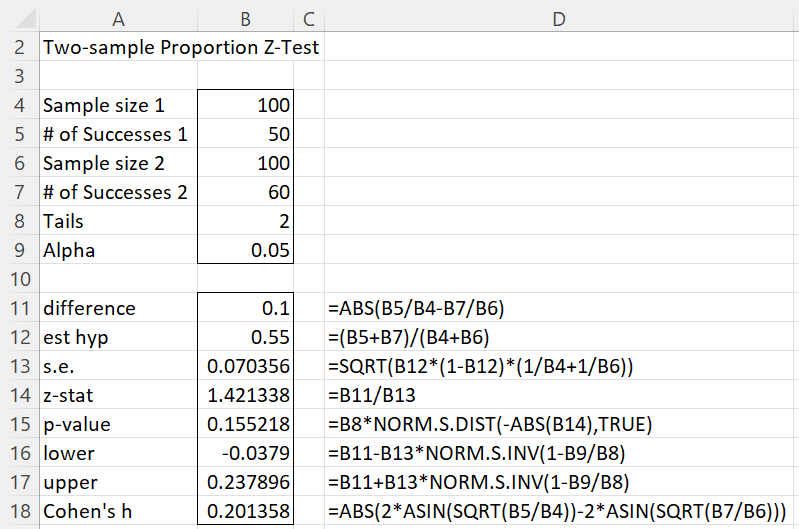
Figure 5 – Output from Two-sample Proportion Test
The results agree with those shown in Example 1 of Two-sample Proportion Testing. The 95% confidence interval is (-.0379, .238) and Cohen’s h effect size is .201, a small effect.
Examples Workbook
Click here to download the Excel workbook with the examples described on this webpage.
References
Influential Points (2020) Confidence intervals of proportions and rates
https://influentialpoints.com/Training/confidence_intervals_of_proportions-principles-properties-assumptions.htm
Wikipedia (2020) Binomial proportion confidence interval
https://en.wikipedia.org/wiki/Binomial_proportion_confidence_interval
Real-Statistics is an impressive website. Thanks to you and your team for creating it.
My question is about the PropCI function. I have a spreadsheet with rows of data which include a proportion field and I want to create confidence intervals for that proportion in each row. I am new to using array functions in excel, and I would like to know if there is a way to modify the PropCI function so that it displays the lower and upper confidence bounds side by side in adjacent cells instead of one below the other? That way the both the upper and lower confidence bounds will be on the same row as the data from which they have been calculated and I won’t have to manually copy and paste the confidence intervals.
Thanks again for this very useful website.
Hello George,
Thanks for your kind remarks about the Real Statistics website.
Can you use Transpose(PropCI(p, n, lab, type, alpha)) instead of PropCI(p, n, lab, type, alpha)?
Charles
That works. Thanks!
Hi
I get for Cohen’s h in figure 5 the formula:
‘=ABS(2*ASIN(SQRT(J148/J147))-2*ASIN(SQRT(J150J149)))
It seems that the divide by sign in SQRT(J150J149) is missing
Love your work here
Q
Hi Q,
Thanks for pointing out this error. I was supposed to have fixed it in an earlier release, but apparently thid didn’t happen.
I have now provided a better explanation on the webpage, and will fix this bug in the next release.
I appreciate your help in improving the quality of Real Statistics.
Charles
Hi Charles,
Just double checking that the formula for Cohen’s h is correct. Is it not =ABS(2*ASIN(SQRT(B5/B4))-2*ASIN(SQRT(B7/B6))) with a value of 0.2014?
Hi Chris,
I assume that you are referring to Figure 2. That figure uses the formula =ABS(2*ASIN(SQRT(B13))-2*ASIN(SQRT(B6))). Since the formula in cell B13 is B5/B4, the only difference between your formula and mine is that you use B7/B6 (value 2) whereas I use B6 (value .5). Can you give me a reference for your formula?
Charles
Sure thing. (And yes, figure 2)
https://www.real-statistics.com/binomial-and-related-distributions/proportion-distribution/cohens-h-effect-size/
=2*(ASIN(SQRT(p1))-ASIN(SQRT(p2)))
Sorry – figure 5.
Thanks for the clarification, Chris.
You are correct. The calculation of Cohen’s h effect size is incorrect. I have now corrected this on the webpage. I will fix this bug in the Real Statistics software shortly.
Thank you very much for identifying this error and improving the quality of Real Statistics.
Charles
Dear Charls,
Unfortunately, I can not find these options in my add-in,
Do you have an explanation?
Hagai,
Are you using an older version of Excel, namely Excel 2007 or Excel 2011?
Perhaps you are not using the latest version of Real Statistics (7.3 or 7.4).
Charles