The Real Statistics Creating a Grid for Bayesian Analysis data analysis tool can be used to create a grid such as the ones displayed in Figure 2 of Grid Estimation.
Set-up
We now show how this is done for Example 1 of Grid Estimation. First, insert the formulas shown in range B3:B5 of Figure 1. Here, cell B3 represents the random variable, p in this case. You can enter any value in this cell since only the cell address, B3, will be used. The next cell, B4, contains the formula for computing the prior pdf at the value in cell B3. Actually, it is sufficient to use a formula for values that are proportional to the prior pdf. Finally, the last cell, B5, contains the formula for the likelihood function based on the parameter value in cell B3.
Real Statistics Data Analysis Tool
Now, press Ctrl-m, select the Creating a Grid for Bayesian Analysis option (from the Bayes tab if using the MultiPage user interface), and fill in the dialog box that appears as shown on the right side of Figure 1.
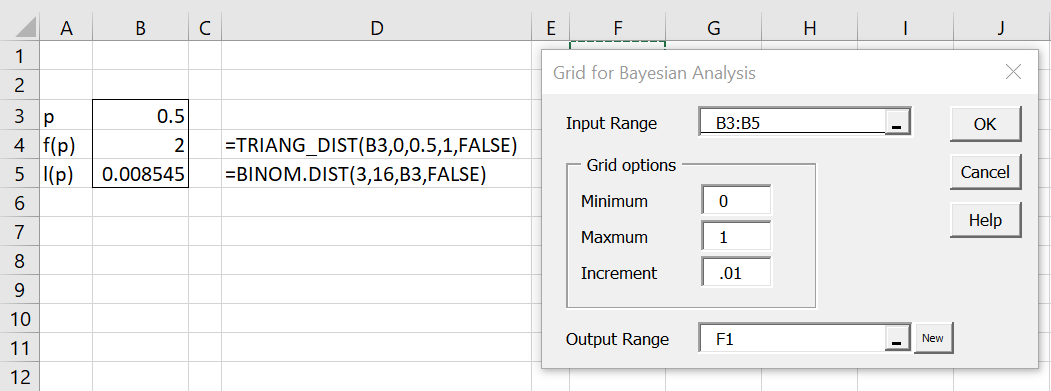
Figure 1 – Grid data analysis tool
Upon pressing the OK button of the dialog box, the output is as shown in Figure 2 (although only the first and last few rows are displayed).
Output
Column F contains the values of p from 0 to 1 in increments of .01 (i.e. the values selected in the Minimum, Maximum, and Increment fields of the dialog box). Columns G and H contain the corresponding prior pdf and likelihood values. For example, cell G5 contains the worksheet formula =TRIANG_DIST(F6,0,0.5,1,FALSE) and H5 contains the worksheet formula =BINOM.DIST(3,16,F6,FALSE). These formulas are based on the formulas in cells B4 and B5.
Cell I5 contains =G5*H5 and cell J5 contains the corresponding estimated posterior pdf using the formula =I7/I$105 where cell I105 contains the formula =SUM(I4:I104). Note that even though the sum of the values of the cells in column G doesn’t add up to one, we get the correct posterior pdf estimates in column J.
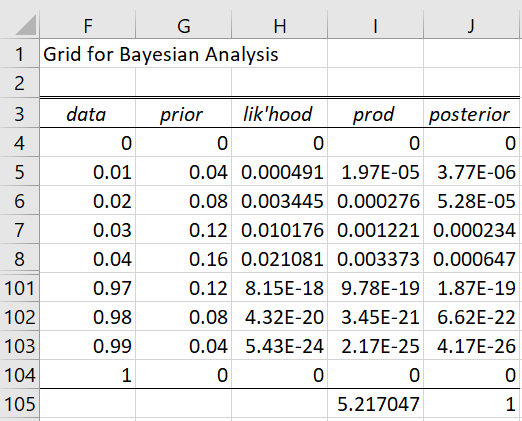
Figure 2 – Grid
Click here for details on how to calculate the 95% high-density interval (HDI) for the posterior distribution in Figure 2 using Real Statistics.
Examples Workbook
Click here to download the Excel workbook with the examples described on this webpage.
Reference
Kruschke, J. K. (2015) Doing Bayesian data analysis. 2nd Ed. Elsevier
https://sites.google.com/site/doingbayesiandataanalysis/
Hi Charles,
I try to follow this page, installed the add ins, but got this error below,
how to trouble shoot it, thank you
—————————
Microsoft Excel
—————————
A run time error has occurred. The analysis tool will be aborted.
Application-defined or object-defined error
—————————
OK
—————————
Hi Ginanjar,
What do you see when you enter the formula =VER() in any cell?
If you email me an Excel file with your data and the analysis that you tried to perform, I will try to figure out what has gone wrong.
Charles
Dear Charles,
Why I can input the function =TRIANG_DIST(F6,0,0.5,1,FALSE) in exel
Thank you very much,
Hoang Hai
Hello Hoang Hai,
See https://www.real-statistics.com/other-key-distributions/uniform-distribution/triangular-distribution/
Charles
Dear Charles,
how did you determine values P(p) (ref. : Real-Statistics-Examples-Bayes.xlsx, sheet Grid 1)
p P(p)
0,0 0,01
0,1 0,03
0,2 0,05
0,3 0,07
0,4 0,09
0,5 0,52
0,6 0,09
0,7 0,07
0,8 0,05
0,9 0,03
1,0 0,01
Thanks in advance.
Mario
Hello Mario,
This is an example that I made up based on a triangular distribution with a spike in the middle.
Charles