HDI Definition
As described in Credible Interval and HDI, a 95% credible interval is an interval in which 95% of the area under the curve representing the pdf y = f(x) is found between the endpoints of the interval (and similarly for any 1–p sized credible interval) The high density interval (HDI) is the smallest such interval. This is the credible interval [a, b] with the smallest b – a.
Using Solver
Example 1: Find the HDI for the Bet(56,46) posterior distribution found in Example 1 of Beta Conjugate Prior.
We use Solver to find the HDI. This is done by first filling in columns T and U in Figure 1, as explained shortly, then selecting Solver from the Data ribbon and filling in the dialog box as shown on the right side of the figure.
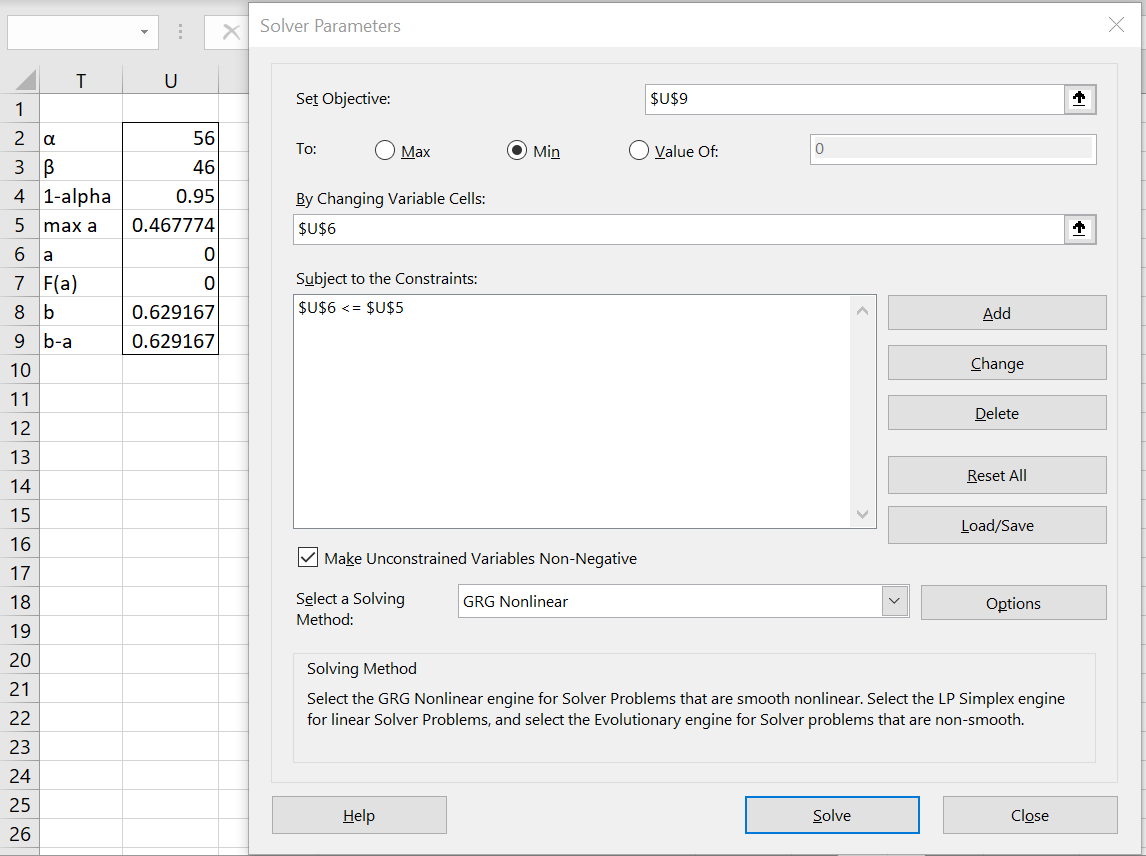
Figure 1 – Using Solver to find HDI
Upon clicking on the Solve button, the results shown in Figure 2 appear. Note too that this figure explains the values and formulas shown in columns T and U.
The resulting HDI is (.452871, .644634). Note that this interval contains values where Bill wins, but more of the interval favors Alan, as we would expect.
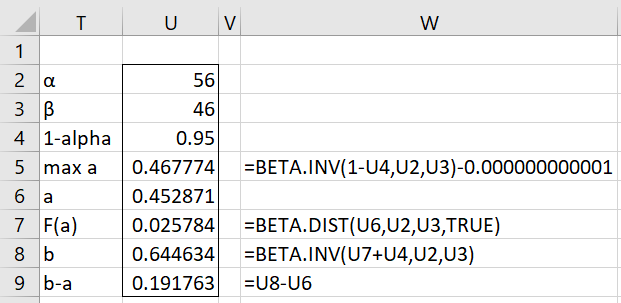
Figure 2 – HDI results
Note that the largest potential value for a occurs when F(a) = .05; at this value b = 1, but since F(1) is undefined for the beta distribution, we must subtract a small value from this value of a, as shown in the formula displayed in cell W5, so that b will be slightly less than 1.
Observation: Another way to look at the problem is to find values of a and b such that
F(b) – F(a) = 1 – α f(a) = f(b)
which is equivalent to finding values of a and b such that
[F(b) – F(a) – (1 – α)]2 + [f(b) – f(a)]2 = 0
This is the situation when the α and β parameters are both greater than 1.
Example 2: Repeat Example 1 of Beta Conjugate Prior assuming a prior beta distribution Bet(4,4). What is the 95% HDI?
By Property 1 of Beta Conjugate Prior, the posterior distribution is Bet(4+3, 4+13) = Bet(7,17). Using the same approach as in Example 1, we see that the 95% HDI is (.122023, .470874). Since the entire interval is less than .5, we have good evidence that the coin is biased towards tails.
Real Statistics Support for HDI
The high density interval can also be calculated using the Real Statistics BETA_HDI function.
Real Statistics Function: The Real Statistics Resource Pack supplies the following array function that calculates the 1–p HDI for the beta distribution Bet(alpha, beta).
BETA_HDI(p, alpha, beta, lab, iter): returns a column array with the following entries: endpoints of the 1– p HDI, length of the HDI and the pdf values at the two endpoints
If lab = TRUE (default FALSE) a column of labels is appended to the output. iter = the number of iterations (default 40) in the divide and conquer algorithm used.
We can use this function to produce the results for Example 2 that are shown in Figure 2. This is done by inserting the array worksheet formula =BETA_HDI(G4,G2,G3,TRUE) in range F6:G10, as shown in Figure 3. Note that the pdf at the endpoints of the HDI are equal, as expected.
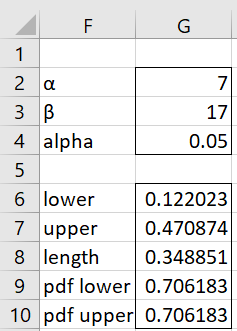
Figure 3 – HDI formula
Beta Prime Support
The Real Statistics Resource Pack also provides the following similar function for the beta prime distribution:
BETA2_HDI(p, alpha, beta, lab, iter): returns a column array with the following entries: endpoints of the 1– p HDI, length of the HDI and the pdf values at the two endpoints.
Examples Workbook
Click here to download the Excel workbook with the examples described on this webpage.
Reference
Lee, P. M. (2012) Bayesian statistics an introduction. 4th Ed. Wiley
https://www.wiley.com/en-us/Bayesian+Statistics%3A+An+Introduction%2C+4th+Edition-p-9781118332573