Objective
We describe the Bayesian version of Kendall’s tau non-parametric test for association.
Basic Concepts
As in Kendall’s Tau Correlation, we define tau for pairs of elements from X and Y as follows:
![]()
where nc is the number of concordant pairs and nd is the number of discordant pairs.
In Kendall’s Correlation Testing with Ties we use tau-b to handle ties. This time we use tau-a which is defined as
![]()
where n = number of elements in X (or Y) and
![]()
where ti = the counts of ties in sample X, ui = the counts of ties in sample Y, and vi = the counts of ties across both X and Y.
In this case nc + nd = C(n, 2) – tx – ty + txy, and so the two expressions for tau are equal.
We now define the concordant proportion φ as the population version of nc /(nc + nd). Note that
![]()
We view φ as a random variable. Since it takes values between 0 and 1 where any sample element is 0 for discordant or 1 for concordant, we consider the data as following a binomial distribution, and so, as usual, we assume a beta prior, typically the uniform distribution, and a beta posterior.
Example
Example 1: Calculate tau-a for the data in columns A and B of Figure 1 and calculate BF10 for the alternative hypothesis τ > 0.
First, we sort the data in columns A so that the X values are in ascending order. This is done by using the array formula =QSORTRows(A2:B22) in range D2:E22. We now calculate the number of concordant pairs in column G and discordant pairs in column H. This is done by inserting the formula
=COUNTIFS(D3:D$22,”<>”&D2,E3:E$22,”>”&E2)
in cell G2 and the formula
=COUNTIFS(D3:D$22,”<>”&D2,E3:E$22,”<“&E2)
in cell H2. Next we highlight range G2:H22, and press Ctrl-D. Finally, we calculate the sums as shown in cell G23 and H23.

Figure 1 – Calculating tau-a
We now calculate tau-a and phi as shown in Figure 2. Using a uniform prior (as shown in K8 and K9), we model phi using a Bet(129, 69) posterior distribution. We can now use the formula =BayesBeta(K10,K11,TRUE) to obtain the descriptive information about phi shown in range O3:P15. Here we are using the default null hypothesis φ < .5.
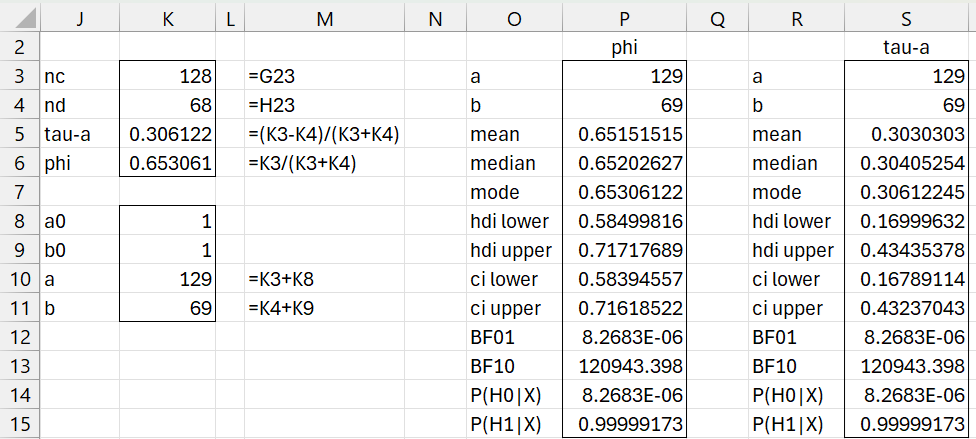
Figure 2 – Hypothesis testing for tau-a
Finally, we convert the descriptive information about phi to information about tau by using the relationship τ = 2φ – 1. This is done by copying the output in O3:P15 to range R3:S15, and then inserting the formula =P5*2-1 in cell S5, highlighting range S5:S11, and pressing Ctrl-D. Note too that the null hypothesis φ < .5 translates into τ = 2φ –1 < 2(.5)-1 = 0.
We see that the data provides overwhelming support for the alternative hypothesis, with BF10 = 120,943.
Worksheet Functions
The Real Statistics Resource Pack provides the following worksheet function.
BayesTau(Rx, Ry, lab): return a column array with the values nc, nd, tau, phi.
BayesKendall(Rx, Ry, lab, a, b, alpha, hyp): return a column array similar to that in column S preceded by the nc, nd, tau, phi values. Here, a and b are the beta prior parameters (default 1), alpha is used for the credible intervals (default .05) and hyp is the test statistic for tau (default 0).
Bayes1Kendall(a, b, lab, alpha, hyp): return a column array similar to that in column S. Here, a and b are the beta posterior parameters, alpha is used for the credible intervals (default .05) and hyp is the test statistic for tau (default 0).
If lab = TRUE (default FALSE) then a column of labels is appended to the output.
Data Analysis Tool
Example 2: Repeat Example 1 using the Real Statistics Bayesian Correlation Test data analysis tool.
To use this tool for Example 1, press Ctrl-m and select the Bayesian Correlation Test option from the Bayes tab. Fill in the dialog box that appears as shown in Figure 3.
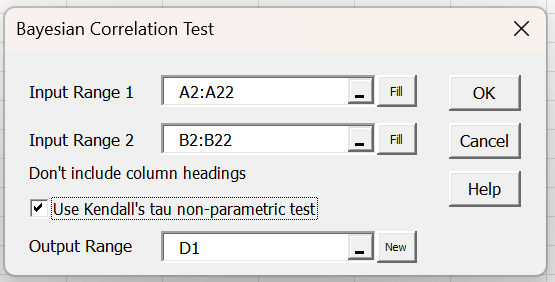
Figure 3 – Kendall’s correlation test dialog box
After clicking on the OK button, the output shown in Figure 4 will appear.

Figure 4 – Kendall’s correlation test output
Range D3:E6 contains the array formula =BayesTau(A2:A22,B2:B22,TRUE) and range G3:H15 contains the array formula =Bayes1Kendall(E3+E8,E4+E9,TRUE,E10,E11).
The array formula =BayesKendall(A2:A22, B2:B22,TRUE) would produce the output shown in range D3:E6 following by the output in G3:H15.
Examples Workbook
Click here to download the Excel workbook with the examples described on this webpage.
References
Chechile, R. A., Barch, D. H. Jr. (2025) Distribution-free Bayesian analyses with the DFBA statistical package
https://link.springer.com/article/10.3758/s13428-025-02605-6