Objective
We describe worksheet functions and data analysis tools that can be used to perform Bayesian independence testing in Excel. These capabilities implement the approach described in Bayesian Independence Testing and are provided by the Real Statistics Resource Pack.
Worksheet Functions
The Real Statistics Resource Pack provides the following worksheet array function in support of Bayesian independence testing.
BayesIndep(R1, stype, lab, R2): returns an array with the values BF01, BF10, P(H0|X), and P(H1|X) for an m × n contingency table (w/o labels) in R1 based on priors in the m × n R2. R2 can be replaced a single numeric value a (default 1).
stype takes the values “p”, “j”, “r”, “c” or “h” (default “p”) indicating the sampling approach Poisson, Joint multinomial, Independent multinomial with fixed row totals, Independent multinomial with fixed column totals, or Hypergeometric, respectively. The “h” option can only be used when R1 contains a 2 × 2 contingency table.
If lab = TRUE (default FALSE) then a column of labels is appended to the output.
The above function uses the following non-array function.
DFunc(R1) = the Dirichlet function on the data in R1.
See Bayesian Independence Testing for a definition of this function.
Examples
Figure 1 displays the output from the BayesIndep function for the two contingency tables shown on the left side of the figure.
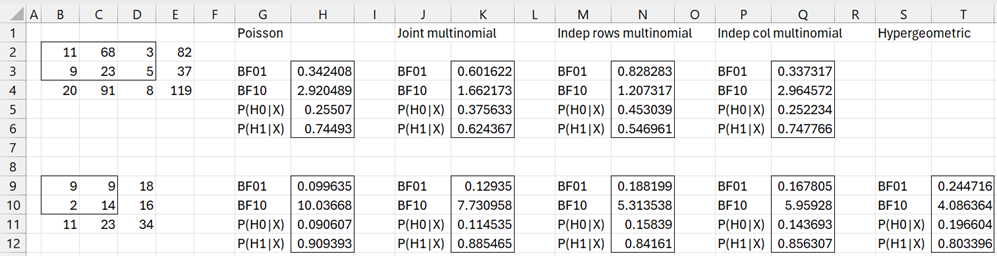
Figure 1 – BayesIndep examples
For example, range J3:K6 contains the formula =BayesIndep(B2:D3,”j”,TRUE,1).
Data Analysis Tool
The Real Statistics Resource Pack also provides the Bayesian Independence Test data analysis tool.
For example, to use this tool for the data in range B2:D3 of Figure 1 using the Joint multinomial sampling method, press Ctrl-m and choose the Bayesian Independence Test option from the Bayes tab. Fill in the dialog box that appears as shown on the right side of Figure 2.
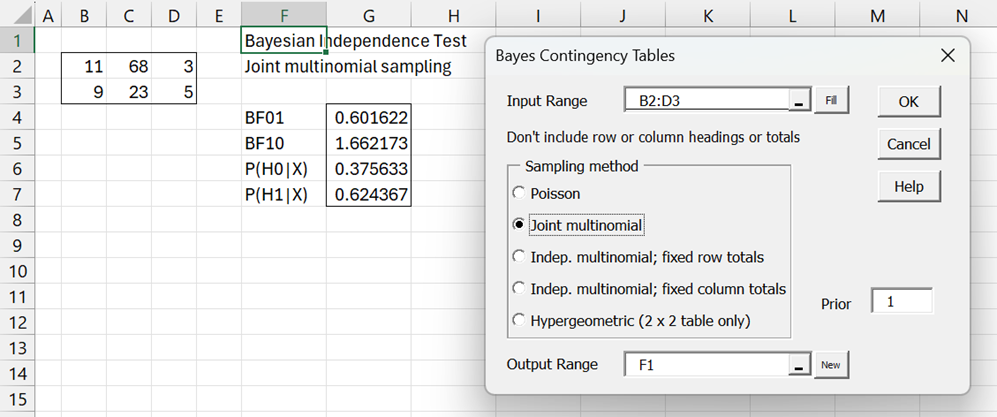
Figure 2 – Bayesian Independence Test
Data Conversion
The Real Statistics Resource Pack also provides the following two worksheet functions to convert between two representations of a contingency table.
TABLE2RAW(R1): takes the m × n contingency table in R1 with row and column labels as input and outputs an equivalent k × 2 array with raw labels where k = the grand total of the values in R1. Column 1 of the output contains row labels from R1 and column 2 contains column labels from R1.
RAW2TABLE(R1): takes the k × 2 array of row and column labels as input and outputs an equivalent m × n contingency table with row and column labels.
Example
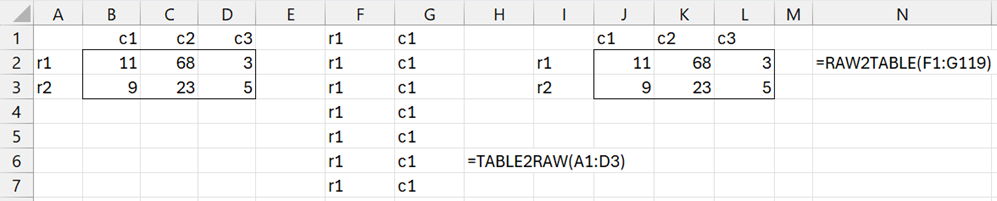
Figure 3 – Contingency table conversions
Here range E1:F119 contains the output from the array formula =TABLE2RAW(A1:D3). This output consists of 11 pairs (r1, c1), 68 pairs (r1, c2), etc. The figure only displays the first few pairs.
Range I1:L3 contains the output from the array formula =RAW2TABLE(E1:F119). This output is equivalent to the original contingency table in range A1:D3.
Examples Workbook
Click here to download the Excel workbook with the examples described on this webpage.
References
Jamil, T., Ly, A., Morey, R. D., Love, J., Marsman, M., Wagenmakers, E-J. (2016) Default “Gunel and Dickey” Bayes factors for contingency tables
https://www.alexander-ly.com/wp-content/uploads/2014/09/JamilEtAlGunelDickeyinpress.pdf
Albert, J. (2009) Bayesian computation with R, 2nd ed. Springer