Objective
Our goal is to describe how to conduct a correlation hypothesis test using a Bayesian approach in Excel. See Bayesian Hypothesis Testing and Correlation Testing for background information.
Basic Concepts
Suppose we have two samples X = x1, …, xn and Y = y1, …, yn, and we want to test the hypotheses
H0: ρ = 0
H1: ρ ≠ 0
We redefine this problem as one in which we compare two regression models:
M0: y = α + ε
M1: y = α +βx + ε
with ε ∼ N(0, σ2).
R2 for M1, which is the square of the sample correlation coefficient r, is a measure of how much better model M1 is than model M0.
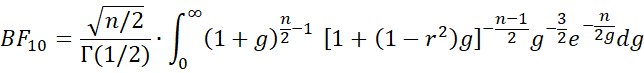
Using a JZS prior for β and a Jeffreys’ prior σ2 ∝ 1/σ2, we obtain
Example
Example 1: Repeat Example 1 from Correlation Testing via t Test using a Bayesian approach. The data is repeated in range A1:B16 of Figure 1.
The analysis is shown on the right side of Figure 1, and uses the Real Statistics INTEGRAL worksheet function.
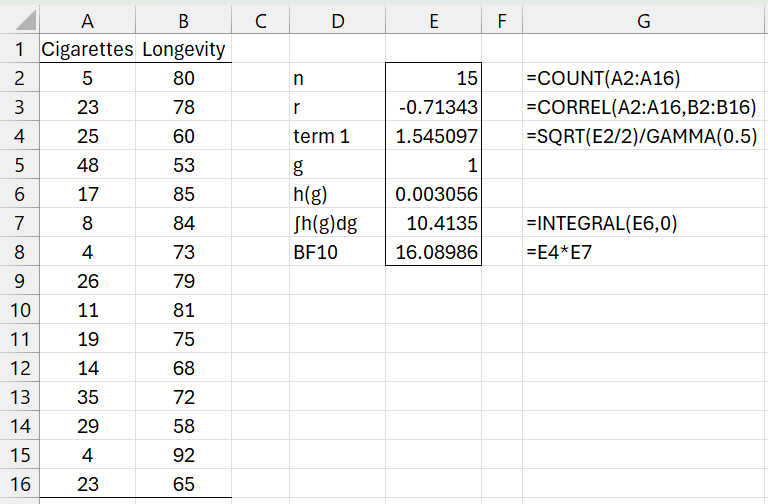
Figure 1 – Bayesian Correlation Test
The formula in cell E6 is
=(1+E5)^(E$2/2-1)*(1+(1-E$3^2)*E5)^((1-E$2)/2)*E5^(-1.5)*EXP(-E$2/(2*E5))
We see that the test shows substantial support for ρ ≠ 0 (BF10 = 16.09).
Worksheet Function
The Real Statistics Resource Pack provides the following worksheet function:
BayesCorrel(r, n, lab, iter): returns an array with the values BF01, BF10, P(H0|X), and P(H1|X) for a Bayesian one sample correlation where r = the sample correlation coefficient based on two samples of size n.
If lab = TRUE (default FALSE), then a column of labels is appended to the output. iter = the number of iterations used in calculating the integral (default 10000).
Data Analysis Tool
The Real Statistics Resource Pack provides the Bayesian Correlation Test data analysis tool.
To use this tool for Example 1, press Ctrl-m and select the Bayesian Correlation Test option from the Bayes tab. Fill in the dialog box that appears as shown in Figure 2.
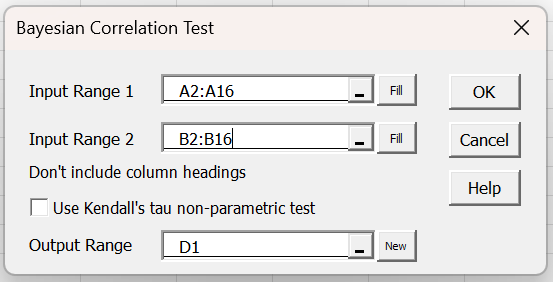
Figure 2 – Bayesian Correlation Test dialog box
After clicking on the OK button, the output shown in Figure 3 appears.
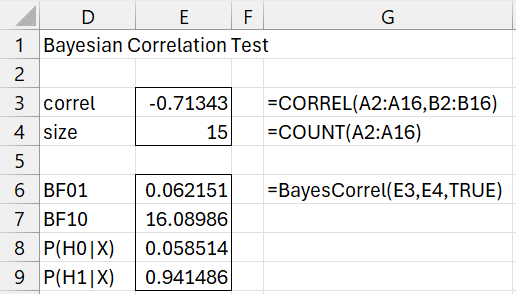
Figure 3 – Bayesian Correlation Test Function
We see that the probability that the population correlation coefficient ρ = 0 is only 5.9%, providing substantial evidence in favor of the alternative hypothesis.
Examples Workbook
Click here to download the Excel workbook with the examples described on this webpage.
References
Wetzels, R., Wagenmakers, E-J. (2012) A default Bayesian hypothesis test for correlations and partial correlations
https://dare.uva.nl/search?identifier=8eaf2fee-dc8f-419d-837e-2e4efd91ea47
Liang, F., Paulo, R., Molina, G., Clyde, M. A., Berger, J. O. (2009) Mixtures of g priors for Bayesian variable selection. Journal of the American Statistical Association, 103, 410.
https://www.researchgate.net/publication/4743606_Mixtures_of_g_Priors_for_Bayesian_Variable_Selection