Data Analysis Tool
Real Statistics Data Analysis Tool: The repeated measures ANOVA analysis required for two within-subjects factors can be performed using Real Statistics’ Two-way Repeated Measures Anova data analysis tool.
For Example 1 of Two-way Repeated Measures Anova, press Ctrl-m and click on the Anova tab (or choose the ANOVA option if using the original user interface). Next, choose the Two-way Repeated Measures Anova option. Fill in the dialog box that appears as shown in Figure 1. The data for this example is repeated in Figure 2.
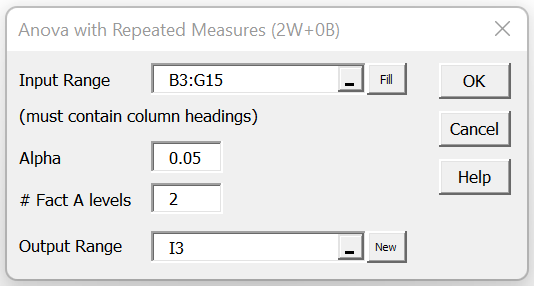
Figure 1 – Two-way Repeated Measures Anova dialog box
Here, Factor A is the Time factor with the two values Pre and Post, as shown in Figure 2.
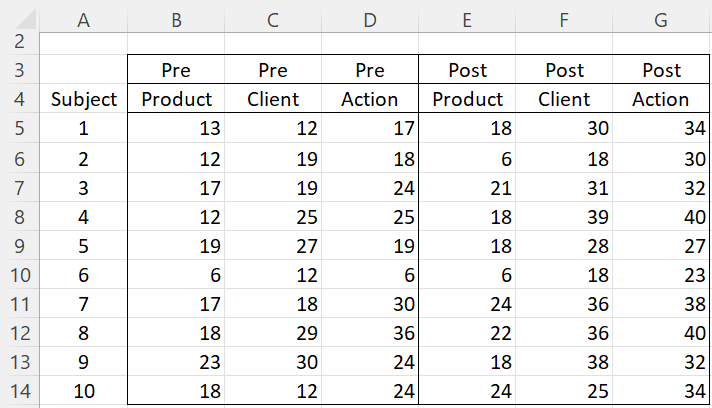
Figure 2 – Example Data
Tool Output
After clicking on the OK button on the dialog box, the output in Figures 3, 4, and 5 are displayed.
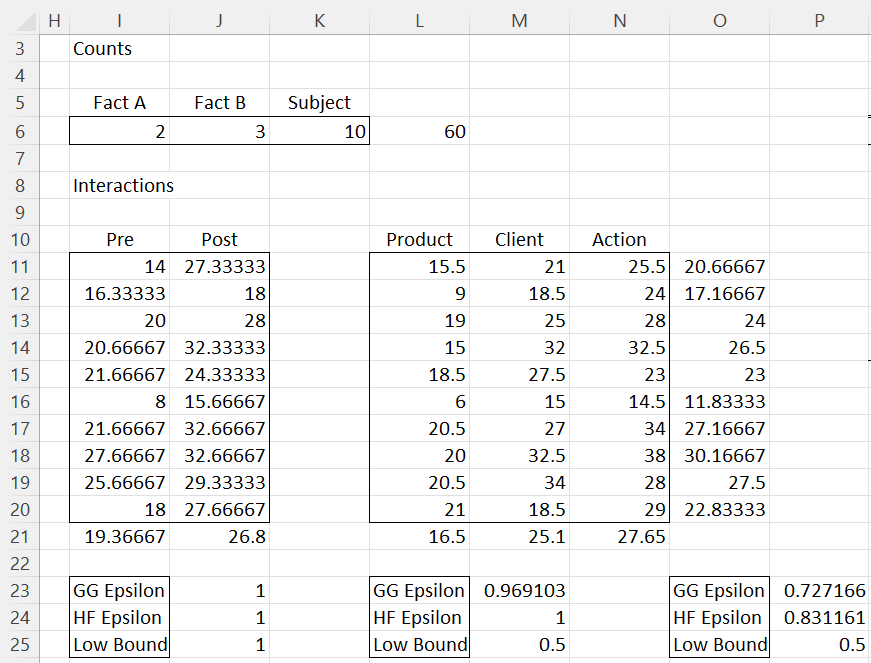
Figure 3 – Repeated Measures output (part 1)
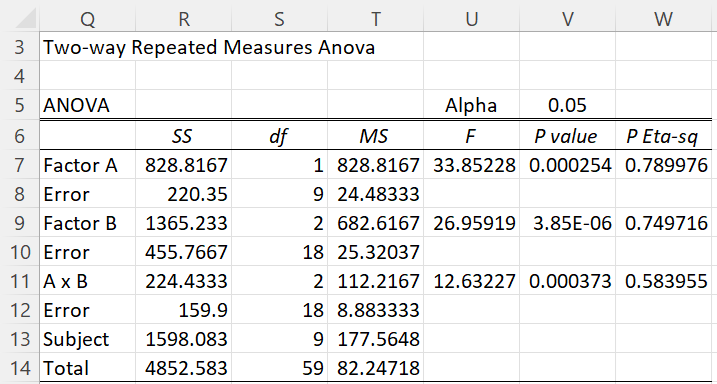
Figure 4 – Repeated Measures output (part 2)
Results after applying a sphericity correction:
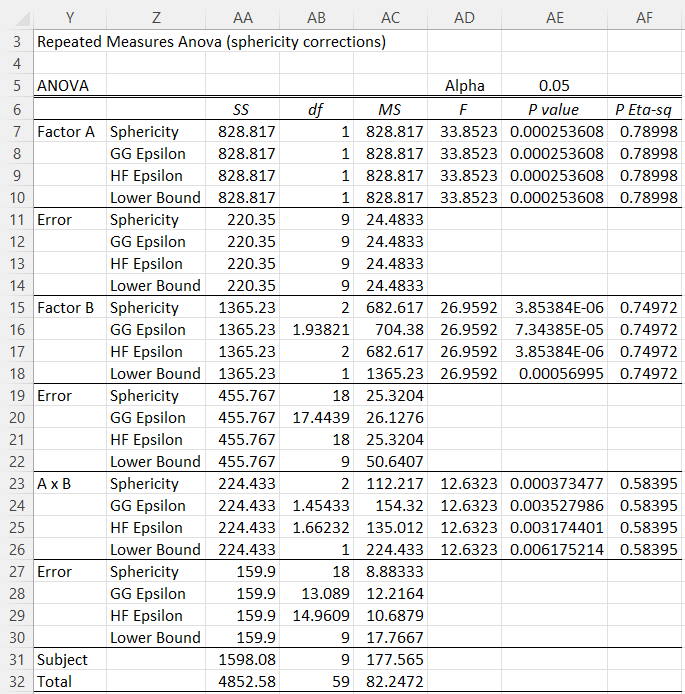
Figure 5 – Repeated Measures output (part 3)
Representative Formulas
Figure 6 displays representative formulas from Figure 3 regarding counts, factor means, and correction factors.
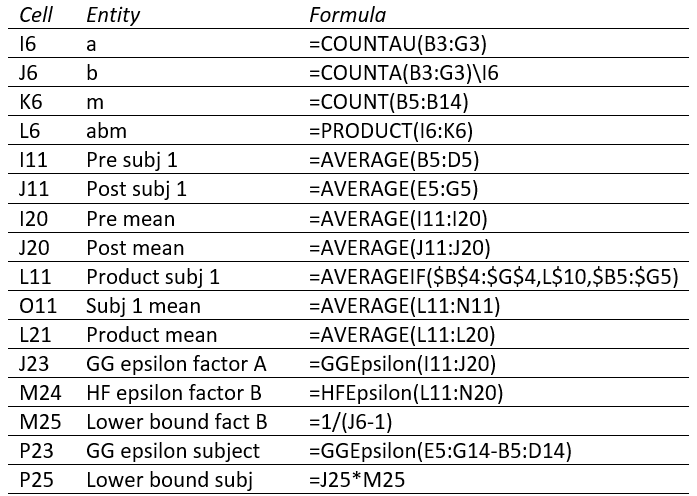
Figure 6 – Formulas from Figure 3
We also see that Figure 7 displays representative formulas from Figure 4 about degrees of freedom, while Figure 8 displays formulas about SS values.
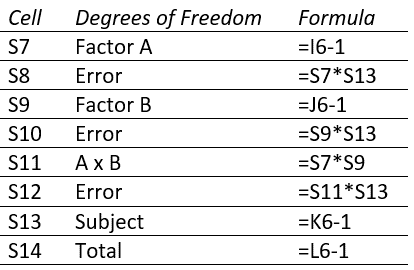
Figure 7 – Df formulas from Figure 4
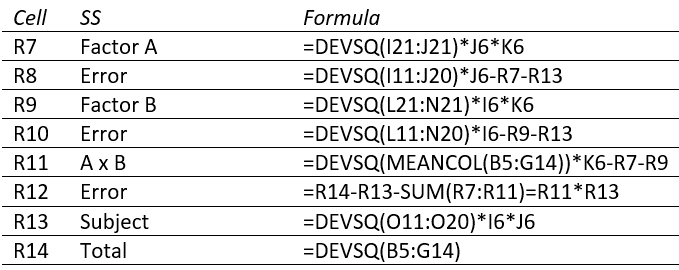
Figure 8 – SS formulas from Figure 4
The values in Figure 5 are the same as those in Figure 4 except that the Factor A df values are multiplied by the corresponding values in J23:J25, the Factor B df values are multiplied by the corresponding values in M23:M25, and the A × B df values are multiplied by the corresponding values in P23:P25.
Contrasts
Real Statistics Data Analysis Tool: The contrasts used in Examples 2 and 3 of Two-way Repeated Measures Anova (based on the data in Figure 2) can also be produced using the Contrasts option of the Repeated Measures Anova data analysis tool found in the Real Statistics Resource Pack.
First, enter Ctrl-m and select One Factor Repeated Measures Anova from the Anova tab (or from the ANOVA option if using the original user interface). A dialog box will appear as in Figure 1 of Repeated Measures Anova Tool. Next, enter the appropriate range in the Input Range field, select the Contrasts option, choose the appropriate Alpha correction for contrasts option (see Figure 1 of Repeated Measures Anova Tool), and click on OK.
For Example 2 you should choose the range J5:K14 in the worksheet from Figure 2 as the input. For Example 3 you should choose the range M5:O14 as the input. In both cases, you will need to deselect the Column headings included with data option and add the headings manually.
Examples Workbook
Click here to download the Excel workbook with the examples described on this webpage.
References
Howell, D. C. (2010) Statistical methods for psychology (7th ed.). Wadsworth, Cengage Learning.
https://labs.la.utexas.edu/gilden/files/2016/05/Statistics-Text.pdf
Maxwell, S. E., Delaney, H. D., Kelley, K. (2018) Designing experiments and analyzing data. Routledge.
https://www.routledge.com/Designing-Experiments-and-Analyzing-Data-A-Model-Comparison-Perspective/Maxwell-Delaney-Kelley/p/book/9781138892286
Hello Charles,
I was curious about how a different data scale might effect the two-way repeated measures results. I divided the Client values by 10 so that, e.g. subject 1 pre-training client value was 1.2, etc. The ANOVA output was completely different, e.g. Factor A p=1.67E-4 instead of 2.54E-4. It seems to me that changing scales should not affect the results, and wonder if we should normalize data by dividing by the mean of each type of sample.
Thanks,
Hello Dave,
It does seem curious. I wonder if you would get similar results if the p-value weren’t so small.
Charles
Charles,
When the Post Action data are divided by 2, which makes the Post average only slightly greater than Pre, the resulting Factor A p value is 0.137. When the pre and post client values are re-scaled by dividing by 10, as before, the Factor A p becomes 0.222. For both of these modified data sets if the data are normalized by dividing by the skill mean, the Factor A p is 0.266. Normalization makes the most intuitive sense to me for comparison of the overall pre and post effects, but I suppose there must be down sides. Thanks for your suggestions.
Dear Charles Zaiontz,
Thank you for making this useful website.
I tried using the Two-way Repeated Measures Anova Tool and sadly in Figure 4 the Factor A error SS is negative. Could you please advise me what I can do to find the error?
Hello Tomasz,
Glad that you are finding the website useful.
If the SS value is something like -1.2E-10, then even though this is a negative value, it is essentially zero. Due to rounding errors, Excel will occasionally produce such a negative value instead of zero. In any case, treat this value as zero. SS can only be zero if all the data values are identical.
If SS is some other negative value, then probably there is an error. If you send me an Excel file with your data and results, I will try to figure out what has gone wrong.
Charles