We show how to perform Repeated Measures ANOVA using regression where there is one within-subjects factor and no between-subjects factor. This is the situation that we describe in One Within Subjects Factor. This time we will use regression to perform the analysis.
Repeated Measures ANOVA Example
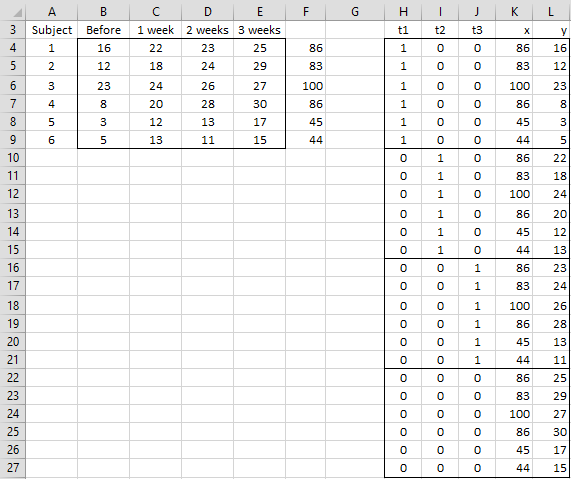
Example 1: Repeat Example 1 of One Within Subjects Factor with the data shown range A3:E9 of Figure 1 using regression.
Figure 1 – Coding for Repeated Measures ANOVA
If we don’t consider sphericity, this example is equivalent to a two-fixed factor ANOVA without replication. And so we can use a regression approach employing dummy coding as explained in ANOVA using Regression. Instead, we will use a simplified approach. First, we add a column F, each of whose cells contains the sums of the other values in that row; e.g. cell F4 contains the formula =SUM(B4:E4).
Approach using Regression
We now use the usual coding (t1 corresponds to Before, t2 to 1 week and t3 to 2 weeks) as shown in range H3:H27 of Figure 1, except that we append repeated versions of the values in column F (labeled x).
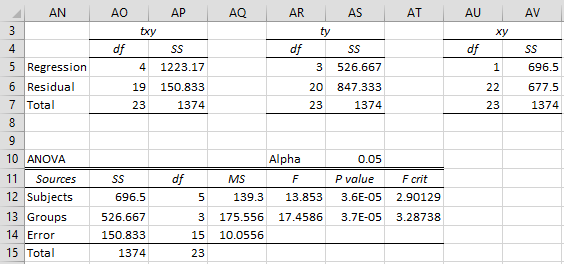
We now carry out three regressions where y is the dependent variable. In regression 1, the independent variables are t1, t2, t3, x. In regression 2, the independent variables are t1, t2, t3. Finally, in regression 3, the independent variable is x. We only care about the df and SS values from each of these regressions. The results of these three regressions are shown in range AN3:AV7 of Figure 2.
Figure 2 – ANOVA via regression
To create the repeated measures ANOVA table shown in AN10:AT15 of Figure 2, we observe that the degrees of freedom values can be calculated via the following four formulas =(AO7+1)/AO5-1 for cell AP12, =AR5 (or =AO5+1) for cell AP13, =AP15-AP12-AP13 for cell AP14 and =AO7 for cell AP15. Note that we only need the df values from the first regression (labeled txy).
We can calculate the SS values via the following formulas =AV5 for cell AO12, =AS5 for cell AO13, =AP6 for cell AO14 and =AP7 for cell AO15. Note that because the value in cell AP5 is equal to the sum of the values in cells AS5 and AV5, we only need two of the three regressions to fill in all the SS values.
The other values in the ANOVA table shown in AN10:AT15 of Figure 2 can be calculated in the usual way. The epsilon corrections can be calculated as described in Sphericity.
Conclusion
Note that the regression approach hasn’t really gained us much since there is no unbalanced version of the type of data in Example 1. In fact, the results obtained will be the same as those obtained using the approach shown in One Within Subjects Factor and Sphericity.
Examples Workbook
Click here to download the Excel workbook with the examples described on this webpage.
Reference
Howell, D. C. (2010) Statistical methods for psychology (7th ed.). Wadsworth, Cengage Learning.
https://labs.la.utexas.edu/gilden/files/2016/05/Statistics-Text.pdf


Where is the model of regression? (Y = c + b T1 + ….)
Ahmed,
I don’t understand your comment. Please explain it further.
Charles