Basic Concepts
We now show how to use the One Repeated Measures Anova data analysis tool to perform follow-up testing after a significant result on the omnibus repeated-measures ANOVA test. We will use the data for Example 1 of Repeated Measures ANOVA Tool as repeated on the left side of Figure 1. The right side of Figure 1 shows the dialog box for the One Repeated Measures Anova data analysis tool.
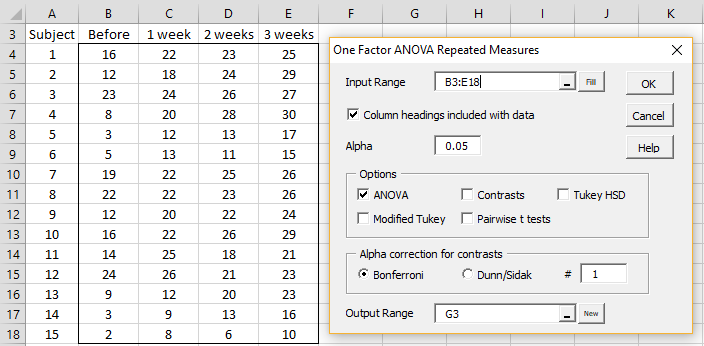
Figure 1 – Data and dialog box for Repeated Measures Anova
You can access the dialog box as described in Repeated Measures ANOVA Tool. In particular, you need to check one or more of the post-hoc options shown in the dialog box.
Contrasts
Contrast post-hoc tests can be performed as described in Planned Comparisons using the dialog box shown in Figure 1. You only need to select the Contrasts option. You can leave the ANOVA option checked, but this is not required.
The number of contrast tests and the familywise correction (Bonferroni or Dunn/Sidàk) are specified in the Alpha correction for contrasts portion of the dialog box. The output is as Figure 3 of One Within Subjects Factor.
Tukey HSD
Real Statistics supports two versions of the Tukey HSD post-hoc test after Repeated Measures ANOVA. In the first version (Tukey HSD option in the dialog box in Figure 1), the standard error used is 
The output for the first version of the Tukey HSD test for the data in Figure 1 is shown in Figure 2.
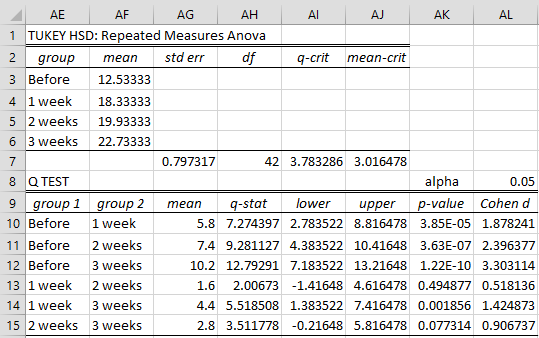
Figure 2 – Tukey HSD test output
The output for the Modified Tukey HSD test for the data in Figure 1 is shown in Figure 3. This is the preferred version of the test.
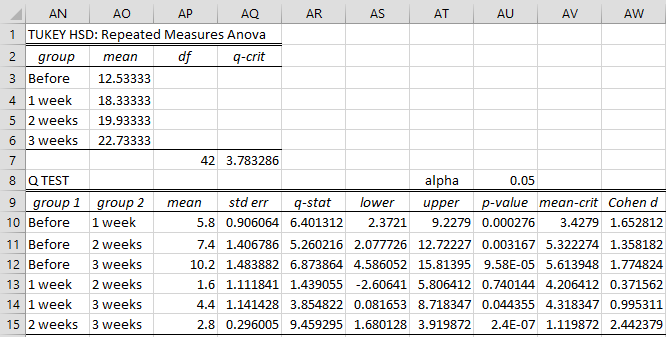
Figure 3 – Modified Tukey HSD test output
Here, all but the 1-week vs 2-weeks comparison are significant. Figure 4 displays some formulas used in the output shown in Figure 3.
| Cell | Entity | Formula |
| AP7 | df | =dfWF(B4:E18,1) |
| AQ7 | q-crit | =QCRIT(COUNT(AO3:AO6),AP7,AU8,2) |
| AP10 | Difference between means | =ABS(AO3-AO4) |
| AQ10 | s.e. for differences between means | =STDERR(B4:B18-C4:C18) |
| AR10 | q-stat | =AP10/AQ10 |
| AS10 | Lower 95% confidence interval | =AP10-AV10 |
| AT10 | Upper 95% confidence interval | =AP10+AV10 |
| AU10 | p-value | =QDIST(AR10,COUNT(AO$3:AO$6),AP$7) |
| AV10 | Critical value for mean differences | =AQ10*AQ$7 |
| AW10 | Cohen’s d | =AR10/SQRT(COUNT(B$4:B$18)) |
Figure 4 – Key formulas from Figure 3
Note that the formula in cell AQ10 is an array formula.
Pairwise t-tests
Another approach for determining which pairwise groups are significantly different following a significant Repeated Measures ANOVA is to use multiple t-tests followed by one of the following tests to deal with familywise error: Bonferroni, Dunn-Sidàak, Holm’s, Hochberg, Benjamini-Hochberg or Benjamini-Yekutieli. This topic is explored in Multiple Tests.
For Repeated Measures ANOVA, pairwise t-tests refer to pairwise paired sample t-tests.
You can obtain pairwise t-tests on the data in Figure 1 using the Pairwise t-tests option in the dialog box in Figure 1. The output is shown in Figure 5.
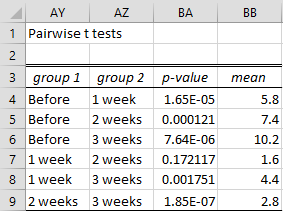
Figure 5 – Pairwise paired sample t-tests
Here, cell BA4 contains the formula =T.TEST(B4:B18,C4:C18,2,1) and cell BB4 contains the formula =ABS(AVERAGE(B4:B18)-AVERAGE(C4:C18)).
Examples Workbook
Click here to download the Excel workbook with the examples described on this webpage
Reference
Howell, D. C. (2010) Statistical methods for psychology (7th ed.). Wadsworth, Cengage Learning.
https://labs.la.utexas.edu/gilden/files/2016/05/Statistics-Text.pdf
Hi Charles! I’m trying to analyze data with different number of repetitions but the results count the empty cells as zero. Is it possible to change that?
Thank you so much,
your page is saving my final grade study 🙂
Hi Julia,
It sounds like you have some missing data. Repeated Measures ANOVA assumes there is no missing data. When you have missing data, you have two choices:
(1) Use one of the approaches for dealing with missing data. The most commonly used approach is to delete any row of data that has one or more missing values. This is probably ok with a relatively small number of missing elements that are missing at random. There are a number of other techniques that are described at https://www.real-statistics.com/handling-missing-data/
(2) Use a different technique. The approach that is commonly recommended is “mixed model”. This approach is more complicated than repeated measures ANOVA. Real Statistics doesn’t yet support this approach. See the following webpage for more information:
https://www.theanalysisfactor.com/when-repeated-measures-anova-not-work-for-repeated-measures-data/#:~:text=One%20of%20the%20biggest%20problems,the%20entire%20case%20gets%20dropped.
Charles