Data Analysis Tool
On this webpage, we describe the Real Statistics data analysis tool that supports repeated measures with one within-subjects factor.
Real Statistics Data Analysis Tool: The One Factor Repeated Measures Anova data analysis tool contained in the Real Statistics Resource Pack can be used to automatically perform analysis of variance for repeated measures, including the calculation of the GG and HF epsilon correction factors.
Example 1: Use the One Factor Repeated Measures Anova data analysis tool to perform the analysis for Example 2 of Sphericity,
Press Ctrl-m, click on the Anova tab, and select One Repeated Measures Anova.
If using the original user interface (instead of the Multipage interface), then press Ctrl-m and double-click on Analysis of Variance (as shown in Figure 0 of Anova Analysis Tool). Next select Repeated Measures Anova: one factor from the dialog box that appears.
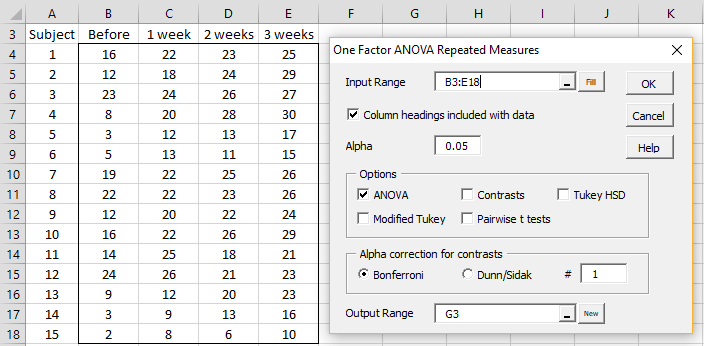
In either case, the dialog box shown in Figure 1 will appear.
Figure 1 – Dialog box for Repeated Measures Anova
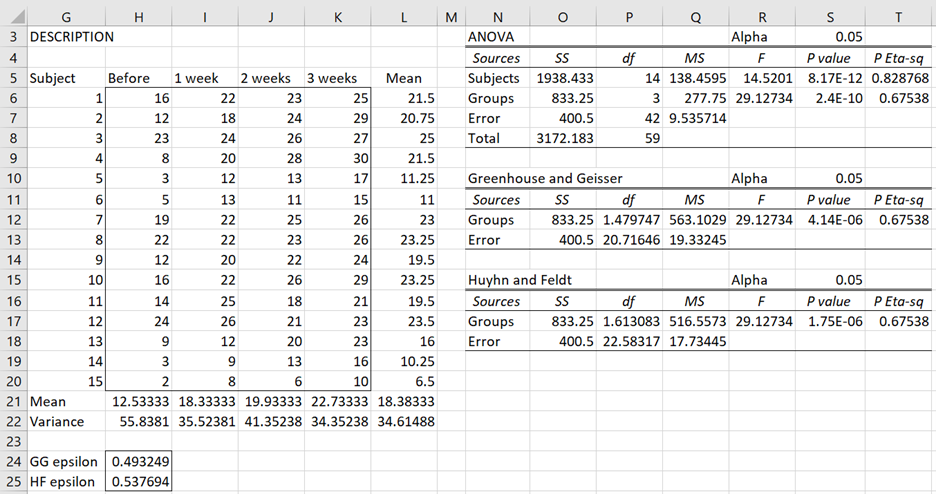
Fill in the dialog box as shown in the figure and click on OK. The output is as shown in Figure 2.
Figure 2 – One Factor Repeated Measures Anova
Sphericity Considerations
A rule of thumb is that if sphericity is greater than .75 then the Huynh and Feldt epsilon should be used; otherwise, the Greenhouse and Geisser epsilon should be used. When sphericity is very low, it might be better to use MANOVA since it does not rely on the sphericity assumption. Another rule of thumb is that for sphericity < .7 you should use MANOVA provided your sample size is at least 10 + # of columns; otherwise, you should use ANOVA.
For more information about sphericity, including other ways of calculating Greenhouse and Geisser epsilon, as well as Mauchly’s test for sphericity, click here.
Effect Size
The effect size measure used in Figure 2 is partial eta-squared, which is calculated for the Group factor by SSG/(SSG+SSE). E.g. cell T5 contains the formula =O6/(O6+O7).
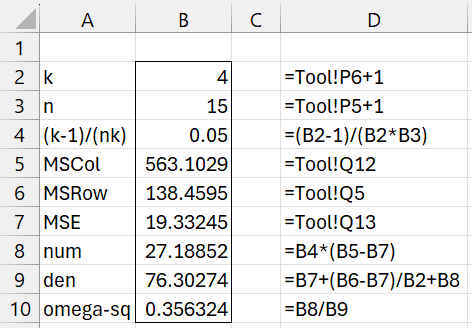
We can also use omega-squared as a measure of effect size, although the formula used is different from the one employed for ANOVA with independent factors.
For Example 1, ω2 = .36 using the GG epsilon correction factor, as shown in Figure 3.
Figure 3 – Omega-squared effect size
As we have noted elsewhere, the effect size for comparisons is more meaningful than the effect size of the omnibus ANOVA.
Post-hoc Tests
As can be seen from the Options on the dialog box in Figure 1, a number of post-hoc tests are available after a significant repeated-measures ANOVA. Click here for a description of these tests and the results of each of these tests on the data in Figure 1.
Examples Workbook
Click here to download the Excel workbook with the examples described on this webpage.
Reference
Howell, D. C. (2010) Statistical methods for psychology (7th ed.). Wadsworth, Cengage Learning.
https://labs.la.utexas.edu/gilden/files/2016/05/Statistics-Text.pdf


Dear Dr. Zaiontz,
First of all, I would like to thank you for your dedication and effort in developing this website and its Excel Resource Pack. It is truly a phenomenal tool.
Regarding the omega-squared effect size formula, Field (2013) mentions it as:
omega-squared = [ [(k-1)/(nk)] (MSeffect – MSerror) ] / [ MSerror + (MSsubject – MSerror)/k + [(k-1)/(nk)] (MSeffect – MSerror) ]
In your formula, the first element in the denominator is MSeffect instead of MSerror, as suggested by Field. Is there a reason for this?
Best wishes,
Giovani
Hello Giovani,
It looks like I made a mistake in copying the formula. I will correct it shortly.
Thanks for catching this error. I appreciate your help in improving the accuracy of the website.
Charles
Giovani,
I have just corrected this error on the webpage. Thanks again for your help.
Charles
Dear Dr. Zaiontz,
I would like to compute the effect size of a 3-way repeated measure ANOVA, each with 2 levels (a 2x2x2 design), for that I used G*Power, but I’m not sure if I used the correct options.
I would like to know the effect size both for the main and interaction effects and also the posthoc t-test.
So I selected, F test, and ANOVA: Repeated measures, within-between interaction.
Type of power analysis:
A priori: compute required sample size – given a, power, and effect size.
I choose the effect size f =0,2
number of groups = 3
number of measurements = 8
corr among rep measures = 0,5
and I got 45 subjects as a result.
I would really appreciate it if you could let me know if I computed correctly.
best wishes,
Philip
Hi Philip,
Yes, I get this value from G*Power if I set Power = .95.
Charles