Basic Concepts
Page’s test is similar to Friedman’s test in that it is a nonparametric replacement for a one-sample repeated measures ANOVA. The null hypothesis is the same, namely that the measures of central tendency for the one within-subjects factor are the same. The difference is that the alternative hypothesis for Page’s test specifies an order to the central tendencies, namely
H1: m1 ≥ m2 ≥ … ≥ mk or m1 ≤ m2 ≤ … ≤ mk
where at least one of these inequalities is a strict inequality.
In this regard, Page’s L test can be considered as the Jonckheere-Terpstre test equivalent for repeated measures ANOVA.
Test Statistic
The steps for conducting this test are as follows:
- Assign the order to the levels of the within-subjects factor (as in the alternative hypothesis)
- Assign ranks yi from 1 to k to each of these levels based on this order
- For each subject, rank the k observations (as for Friedman’s test)
- For each level, add the ranks of the n subject ranks to obtain the total xi
- Define the statistic L to be
![]()
Hypothesis Testing
To determine whether there is a significant trend (i.e. reject the null hypothesis), use the test statistic based on a two-tailed test
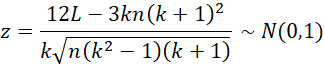
Use the one-tailed test when you know the direction of the ordering and the two-tailed test when you suspect that there is a trend but don’t know the direction.
This approximation is reliable under any of the following conditions:
- n > 20 (with any value of k)
- n > 12 and k > 3
- k > 8 (with any value of n)
Correlation
The overall correlation for this data is given by
![]()
![]()
Note that this is a generalization of Spearman’s coefficient.
Example
Example 1: Repeat Example 1 from One Within-Subjects Factor ANOVA using Page’s L test where you expect that the more time that goes by the higher the score. The data is repeated on the left side of Figure 1.
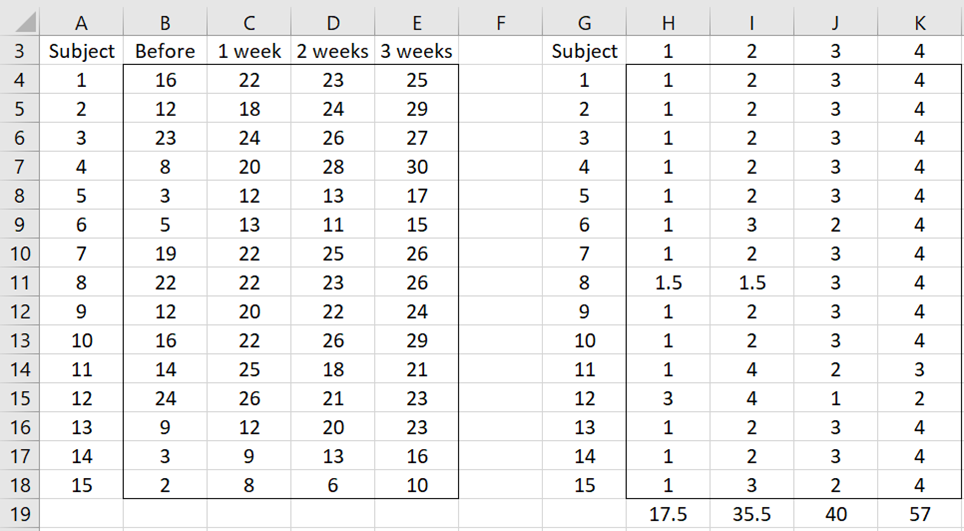
Figure 1 – Ranking of the Data
The right side of the figure displays the row-by-row ranks of the data. We do this by inserting the formula =RANK.AVG(B4,$B4:$E4,1) in cell H4, highlighting range H4:K18, and pressing Ctrl-R and Ctrl-D. Note for early versions of Excel you can use the Real Statistics RANK_AVG function instead of RANK.AVG.
We now add the column totals by inserting =SUM(H4:H18) in cell H19, highlighting range H19:K19, and pressing Ctrl-R.
We next calculate L, z, p-value (for the one-tailed test), and rho as shown in Figure 2.
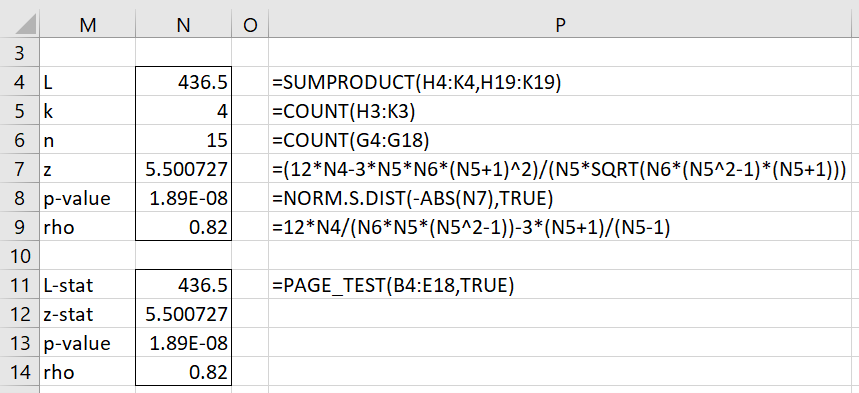
Figure 2 – Page’s L Test
Worksheet Function
Real Statistics Function: The Real Statistics Resource Pack provides the following function for the data in R1.
PAGE_TEST(R1, lab, tails, lookup): returns a column array with the values L, z, p-value, and rho.
R1 must be an array or range with numerical values and no missing data (without headings). If lab = TRUE (default FALSE) a column of labels is appended to the output. tails = 1 (default) or 2.
We can use this function to get the results for Example 1, as shown in range M11:N14 of Figure 2.
Table Lookup
When 4 ≤ k ≤ 10 and 2 ≤ n ≤ 12, or k = 3 and 2 ≤ n ≤ 20, then a table lookup is used instead of the normal approximation described above when the lookup argument is set to TRUE (default). In this case, the z-stat field in the output from PAGE_TEST takes the value N/A.
In addition, the Real Statistics Resource Pack provides the following worksheet functions to generate the critical values and p-values for Page’s test in these cases.
PageCRIT(k, n, alpha, interp) = critical for Page’s test at alpha where the number of within-subject groups is k and the number of subjects is n.
PagePROB(L, k, n, iter, interp, txt) = p-value for Page’s test where the number of within-subject groups is k and the number of subjects is n for the specified value of Page’s L statistic.
The table of critical values specifies a critical value for alpha = .05, .01, and .001. Critical values for other values of alpha between .001 and .05 are determined by interpolation; if interp = FALSE then linear interpolation is used, while if interp = TRUE (default), then the recommended interpolation is used. For PagePROB, iter number of iterations (default = 40) is used.
When txt = FALSE (default), if the p-value is less than .001 then PagePROB returns a p-value of 0, while if the p-value is greater than .05 then a p-value of 1 is returned. When txt = TRUE, then the output takes the form “< .001” or “>.05” instead.
Examples Workbook
Click here to download the Excel workbook with the examples described on this webpage.
References
Statext (2023) Page’s L trend test
https://www.statext.com/practice/PageTrendTest02.php
Wikipedia (2023) Page’s trend test
https://en.wikipedia.org/wiki/Page%27s_trend_test
I completed the Page test calculation in an Excel sheet with the Real Statistics pack installed. However, when I input “=PageCRIT(N5, N6, N21)” in a cell and press Enter, Excel does not output correctly and shows “N/A”. In this case, N5 contains the k value (4), N6 contains the n value (32), and N21 contains the alpha value (0.05). Could you tell me if I made any mistakes in my operation? Why is the function not outputting a result?
Hello Li Zheng,
If you email me an Excel file with your data and calculations, I will try to figure out what is going wrong.
Charles