Basic Concepts
The assumptions that need to be met for the repeated measures analysis described in Example 1 of One Between-Subjects Factor and One Within-Subjects Factor to be valid fall into two categories: assumptions for the between-subjects analysis and those for the within-subjects analysis. We will focus on the between-subjects analysis on this webpage.
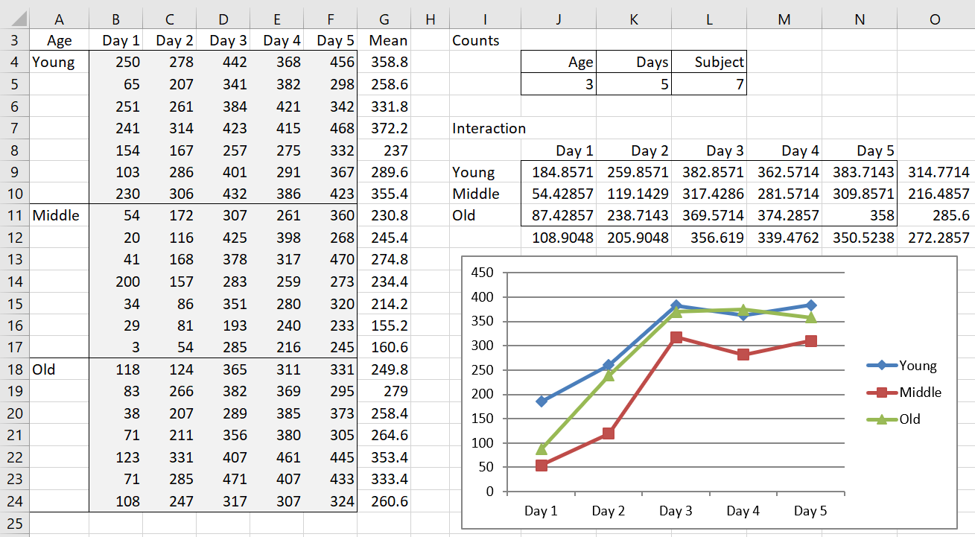
The data for Example 1 is repeated on the left side of Figure 1.
Figure 1 – Data for Example 1
Assumptions
The assumptions for the between-subjects analysis are the familiar ones from Two Factor ANOVA with Replication, namely
- All samples are drawn from normally distributed populations
- All populations have a common variance
- The samples were drawn independently from each other
- Within each sample, the observations were sampled randomly and independently of each other
Normality
To test for normality, for each Age group we need to test the mean values across Days for each subject, i.e. range G4:G10 from Figure 1 for Young, range G11:G17 for Middle and G18:G24 for Old. We show the corresponding box plot in Figure 2.
Figure 2 – Boxplots for within-subjects factor
With such small samples, the results are quite limited, but there is no dramatic departure from symmetry.
Homogeneity of Variances
The key assumption for the between-subject F test to be valid is that the variance of the subject means within any one level of Age is the same as the variance of the subject means within any other Age level. This can be tested by Levene’s test, although ANOVA is robust against moderate violations of this assumption. Since the groups are independent we don’t need to test for sphericity. This follows since if the variances are homogeneous, then the covariance matrices will be equal and compound symmetry will hold. This is so since the independence assumption implies that all the off-diagonal covariances are zero, and so are equal.
Figure 3 compares the variance of the subject means for the Young, Middle and Old samples, and shows via the Levene’s test there is no significant difference between these variances. Hence, the homogeneity of variances assumption is satisfied.
Figure 3 – Levene’s test for the between-subjects factor
Each item in the range BU93:BW99 is the mean across the 5 days of the corresponding elements in the raw data. E.g. cell BU93 contains the mean of the first Young subject, i.e. the value of cell G4 (see Figure 1). The cells in range BU100:BW100 contain the means of the three Age groups. The cells in the range BY93:CA99 contain the deviation of each subject mean from the corresponding Age group mean; e.g. cell BY93 contains the formula =ABS(BU93-BU100). Levene’s test is carried out by performing a one-way ANOVA on the data in the range BY93:CA99. Since the p-value (in cell CH101) = .50 > .05 = α, we conclude there is no significant difference between the Age group variances.
Examples Workbook
Click here to download the Excel workbook with the examples described on this webpage.
Reference
Howell, D. C. (2010) Statistical methods for psychology (7th ed.). Wadsworth, Cengage Learning.
https://labs.la.utexas.edu/gilden/files/2016/05/Statistics-Text.pdf


