On this webpage, we explain how to conduct Cochran’s Q Test for data in frequency table format. See Cochran’s Q Test for the case where data is in raw format.
Example
Example 1: One hundred people are asked to rate four different drug formulations as effective or not for hay fever. Based on the data in Figure 1 (where 1 means effective in treating hay fever and 0 means ineffective in treating hay fever) determine whether there is a significant difference between the four drug formulations.
This time the data is displayed in the form of a frequency table.
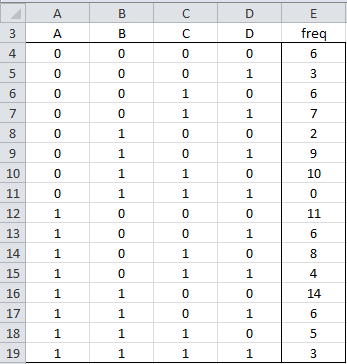
Figure 1 – Data for Cochran’s Q Test
Test Statistic
We use the following version of the Q statistic.
![]()
where m = the number of rows, xij = the value in the ith row and jth column, fi = the frequency for the ith row (thus the total sample size n = 


Results
The calculations are shown in Figure 2.
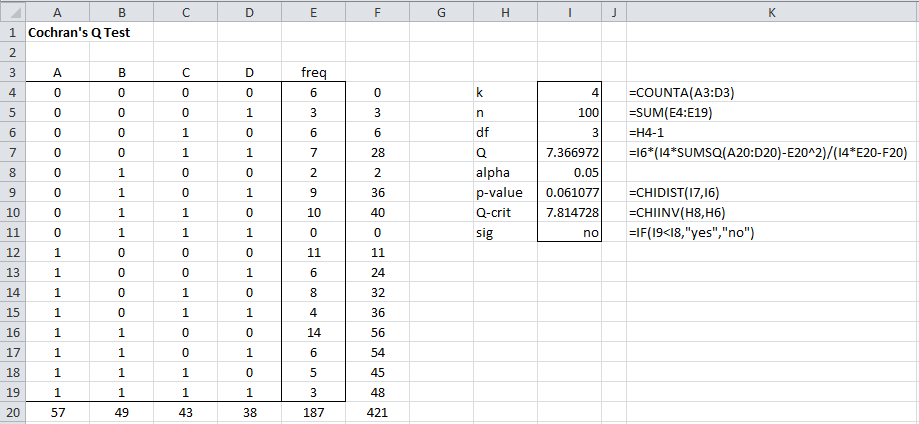
Figure 2 – Cochran’s Q Test
This time p-value = 0.061, and so we cannot reject the null hypothesis that the drugs are equally effective. We display the percentage of effectiveness for each drug in Figure 3 (as shown in row 20 of Figure 2).
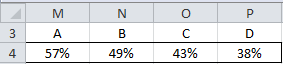
Figure 3 – Percentage of effectiveness
Examples Workbook
Click here to download the Excel workbook with the examples described on this webpage.
References
Wikipedia (2014) Cochran’s Q
https://en.wikipedia.org/wiki/Cochran%27s_Q_test
NCSS (2014) Cochran’s Q test
https://www.ncss.com/wp-content/themes/ncss/pdf/Procedures/NCSS/Cochrans_Q_Test.pdf
What is the Q formula in meta-analysis ? please.
I want to calculate the weighs of some clinical trials with random effects using the MS-Excel. It needs the Q.
Thanks!!
Tsai,
I am not sure that I understand your question, but perhaps the following link will help:
https://www.quora.com/How-is-Cochrans-q-statistic-computed-in-meta-analysis
Charles