Cochran’s Q Test is a non-parametric test for ANOVA with repeated measures where the dependent variable is dichotomous.
Topics
- Using raw data + post-hoc testing: this webpage
- Using summary data
- Real Statistics capabilities
Using Raw Data
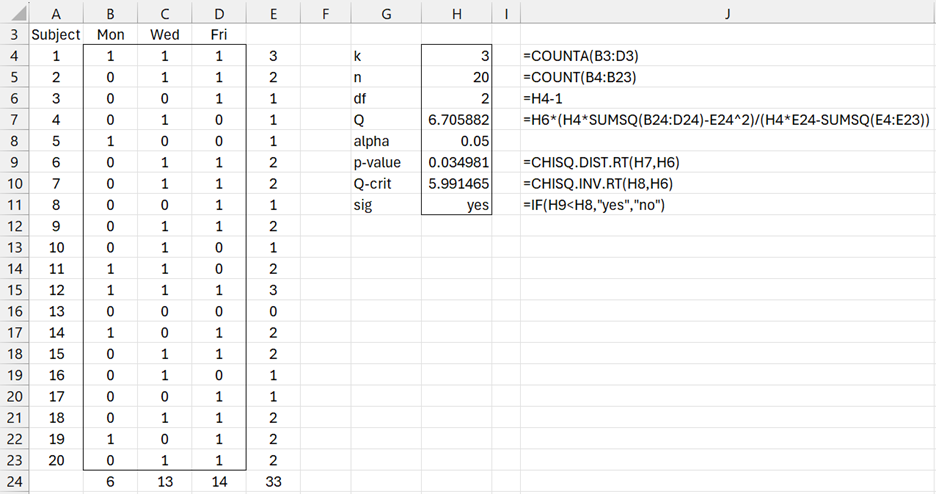
Example 1: Workers at a large plant generally show two types of behavior: energetic and tired. This behavior was measured for 20 workers on Monday, Wednesday, and Friday during one week in March, as shown in Figure 1 (where 1 represents energetic and 0 represents tired). Is there a significant difference in the behaviors between the three time periods?
Figure 1 – Data for Cochran’s Q Test
Let xij = the value in the ith row and jth column and let xi = , xj =
and N =
=
=
.
Now define
for n sufficiently large. The null hypothesis is rejected when Q > .
Observation: The null hypothesis is that the proportion of successes (where 1 represents success and 0 represents failure) is equal across all k groups. E.g. if success represents treatment effectiveness then the null hypothesis means that all k treatments have the same effectiveness.
Example 1 (continued): The calculation of Cochran’s Q test for Example 1 is shown in Figure 2.
Figure 2 – Cochran’s Q Test
Column E contains the xi values (row totals) and row 24 contains the xj values (column totals). Cell E24 contains the value for N.
We see from Figure 2 that Q = 6.706 and p-value = 0.035 < α, and so the result of the test is significant, showing that there is a significant difference between the days.
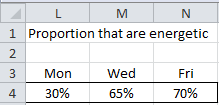
The proportions of workers who were energetic are shown in Figure 3.
Figure 3 – Proportions
Here, for example, cell L4 contains the worksheet formula =B24/$H5.
Follow-up Testing
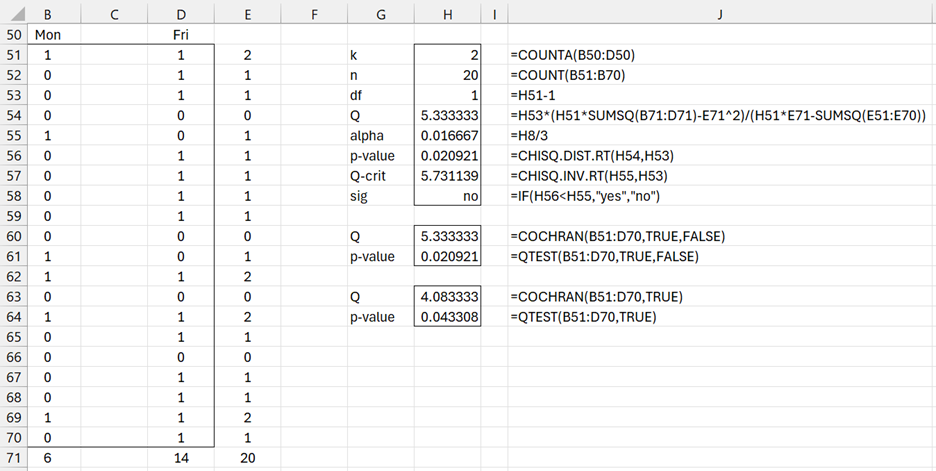
When the null hypothesis is rejected, we can perform follow-up pairwise Cochran’s Q tests (which are equivalent to McNemar’s tests) to better identify where the differences lie. As usual, we need to control for experiment-wise error by using a Bonferroni or Dunn/Sidák correction (Dealing with Familywise Error). For example, if we compare Monday with Friday (by deleting column C from the analysis in Figure 2), we get the results shown in Figure 4.
Figure 4 – Pairwise Cochran’s Q Test
Since p-value = 0.0209 > 0.01667, we see that there isn’t a significant difference between Monday and Friday. Note that p-value = .052204 for the comparison of Monday with Wednesday, and p-value = .738883 for the comparison of Wednesday with Friday. Thus, none of the C(3,2) = 3 pairwise comparisons are significant when using a Bonferroni correction of .05/3 = .01667. The Monday-Friday comparison is closest to significance, and would be significant if the original significance level was .0627.
We can now report our results as follows: There is a significant difference (p-value = .035) between the percentage of workers who are energetic on Monday (30%), Wednesday (65%), and Friday (70%), but none of the pairwise comparisons is significant, although there is almost a significant difference between the percentage of workers who are energetic on Monday and Friday (p-value = .021).
Examples Workbook
Click here to download the Excel workbook with the examples described on this webpage.
References
Wikipedia (2014) Cochran’s Q
https://en.wikipedia.org/wiki/Cochran%27s_Q_test
NCSS (2014) Cochran’s Q test
https://www.ncss.com/wp-content/themes/ncss/pdf/Procedures/NCSS/Cochrans_Q_Test.pdf


Dear Charles,
Thank you very much for your homepage. It is very helpful. I am confused by the post-hoc correction for pairwise Cochran’s Q tests. In the sample example, there are 3 combinations. Thus, I thought alpha should be 0.05/3 = 0.0166 instead of 0.05 based on Bonferroni correction. If so, there is non-significant result between Monday and Friday. Thank you very much in advance.
Hello Takashi,
Yes, you are correct. Thanks for catching this error.
I have now updated the webpage and accompanying Excel spreadsheet taking the Bonferroni correction into account.
I appreciate your help in improving the accuracy of the Real Statistics website.
Charles
Hi Charles,
I very much appreciate your webpage. The statistics are clearly explained here. I tried to recalculate your example in Follow-up Testing. You wrote: “Note that if we had compared Wednesday with Friday we would have gotten a non-significant result with p-value = .05220.“ But according to my calculation, this result is valid for a pair Wednesday and Monday. For the pair Wednesday and Friday a got p-value = 0.7389. Am I correct?
Hi Jirka,
Yes, you are correct. I copied the wrong value. I have now corrected this on the website.
Thank you very much for identifying this error and improving the quality of the website.
Charles
As always, you make things look so simple! Thank you, and keep the great work up!
Thank you. I don’t always succeed, but I try.
Charles
I would like to thank you and to congratulate you for the excellent presentation. You helped me a lot to fill the gap of understanding about Cochran’s q test.
Thousand thanks!
Georgios
Very useful formula until you get to p = 1 (#DIv/0) .
Appreciate that in this scenario it should be obvious to most, however would be nice to get a value if using for a template for data entry people with little maths knowledge.
Kaz,
Are you referencing the situation where the values for all the cells in range B4:D23 are 1?
I don’t understand what you mean by “it would be nice to get a value” presumably in this case (or perhaps other cases that you have in mind).
I am happy to improve the explanation, but I need some clarification from you.
Charles
This page help me a lot to perform the Q Cochran test with my grade thesis, in this case the null hipotesis were accepted, nevertheless when I performed the McNemar test comparing the reference method with the new methods, I’ve got a yes, accepting the hipothesis. Could it be because the results of the new methods are very uniform but when you compare them with the reference method there is a difference.
Diego,
Are you saying that the null hypothesis was accepted when using the Q Cochran as well as McNemar’s test? This would not be surprising.
Charles
Using the example on the page the Q Cochran test accept the null hypothesis, but it’s different with the McNemar test, nevertheless I find that the example have difference with the formula used, is it a mistake or do we need to do some change to perform the McNemar test?
Diego,
Yes, you are correct, the results are different. I will look into to this and get back to you.
Charles
Diego,
I believe that the only difference is that McNemar uses a continuity correction of .5. I will see if I can add this as an option to Cochran’s Q test, so that you can get the same values for both tests.
Charles
Alright! Another test that I’m going to perform on hand using a pen, paper, and calculator.
Hey,
I would like to do a Cochran Test with 2 groups. So I observed the dependent variable (response, no response) over 9 time points in males and females. And I would like to know is the distribution over the 9 time points is the same for males and females. How can I do this (in SPSS)?
Thank you a lot in advance!!
Iris,
Sorry, but this site is about using Excel for statistical analysis, not SPSS. SPSS is a perfectly good tool, but I don’t use it and so am not able to answer your question.
Charles
Thank you so much
I am from Mexico, I am learning from myself to use SPSS and R, unfourtunately, I could´t find a good exercise in books, so with these exercise I understand the nature of the test
Would like to compare answers of 2 test-takers with 5 possibilities/variables.
E.g. Reader A chooses 0 0 1 3 4 for the first five questions.
Reader B chooses 0 1 1 3 2 for the same first questions.
Which test can/should I use?
Thank you for your time,
V
What are you trying to test?
Charles
Thank you.
How does one then calculate the effect size of the different between the days in the example above, and what is an appropriate effect size criteria with which to interpret the effect size, please?
Stuart,
In the case of McNemar’s test (a simple version of Cochran’s Q test) the odds ratio is commonly used measure of effect size. This can be converted into a d effect size as described in a paper by Susan Chinn. See http://www.aliquote.org/pub/odds_meta.pdf
I am not familiar with measures of effect size for Cochran’s Q test, but here is a paper about it.
https://www.researchgate.net/publication/5962747_An_alternative_measure_of_effect_size_for_Cochran's_Q_test_for_related_proportions
Charles
Dear Sir,
thank you for your beautiful and very clear internet site 🙂
Your advice would be precious !
I need to calculate whether there is a significant difference between paired sets of answers over categories (every person chooses 1 category over a set of possible ones, and is asked this question twice) ; these categories can be either purely qualitative (option 1, option 2, … option 7) or qualitative but ordered or quantitative discrete (for instance 1 to 7).
Which would be the most appropriate test(s) ?
(Cochran’s Q test and Mc Nemar seem to apply to binary observations (here there are more than two categories,
and ANOVAs seem to request quantitative data and assume independent samples ?)
A thousand thanks in advance for your precious advice ! 🙂
Kind regards,
Margaret
Sorry Margaret, but I don’t understand the scenario (i.e. the selection of the category and two questions).
Charles
Thank you very much for you answer 🙂 and all my apologies if my question was unclear. Your advice would be really be precious !
Trying to clarify: participants of a test will answer twice the same question (therefore I imagine the answers are paired samples).
The question looks like : ‘How do you interpret the sense of some specific picture ?’ ; answers are categories (‘a revolution’, ‘a celebration’, ‘persons meeting over pure coincidence’… ) which are pureley qualitative (there is no order between them) (so for each category one has the number (or proportion) of participants having chosen it).
This question is then asked later, once the participants have gathered (by themselves) some further insights on the picture (the participants stay the same).
1. My question is : how can one calculate whether there is a significant shift in the answers between the first and the second time the question was asked ?
2. Additionnally how can one calculate whether there is a significant shift in the answers when the answers are not just categories but can be ordered and transformed into discrete numbers (e.g. 1 -> 7) : is it the same kind of calculation or is something else more appropriate ?
3. Which tool would you recommend to identify whether certain a priori characteristics influence the (category) answers of the participants (for instance : do the students in history have a higher tendency than others to see a revolution (possibly because of their studies), or does the number of years of study influence the accuracy of the answer ? or do these two factors act together ?)
Hoping this clarifies (please let me know me otherwise !)
Thank you a thousand time for your precious advice 🙂
Kind regards,
Margaret
All my apologies ! please let me try to clarify.
1. Paired sample : a set of participants is asked the same question twice (they gather new elements in-between and consequently their answers might differ). I guess this would be a paired sample ?
2. More than two categorical answers (as seemingly in Cochran) : the question looks like : ‘How do you interpret this picture ?’ and consequently the answers define different categories (such as ‘coincidental meeting’, ‘revolution’, ‘celebration’, …)
My question is : which is the most appropriate way to calculate whether there is a significant shift in the answers (i.e. a significant change in the proportions of every choice in the final set of answers ?)
If there is no simple way to do this, might you have some idea concerning how to transform this problem to find an appropriate significativity test ?
Many thanks in advance for you precious advice 🙂
kind regards,
Margaret
Hi Charles,
What if you were interested in comparing the results of this factory with that of two other factories? What test would be best to determine if workers from different factories were energetic on different days? Would you start with the Cochran results? Would you instead want to use chi-square exact tests with factories & day values?
Dylan,
Since you are comparing different days chi-square exact test doesn’t seem to be the correct choice. If the dependent variable is some measure of energy level then a mixed repeated measures ANOVA approach seems correct (the factors are day and factory, with an implicit worker factor). If the dependent variable is 0 or 1 (not energetic vs energetic) then you would want a two factor version of Cochran’s test, but I don’t know whether such test exists.
Charles
Dr Charles, please excuseme, I was taking all time the column results, please excuseme
Thank You very much
Thank you very much, but i dont not wich is your email
Thanks
See the webpage
Contact Us
Charles
Dr. Goodnight, Happy Easter, Dr’s a shame to bother these days; please is that if the Cochran Q test is applied following the steps in Excel the same result is obtained value of Q, but using Real Statistics not get the same answer; that penalty is that I’m making a mistake ?, or there is an error in the software?
Happy new year and thank you for your response.
Gerardo,
Happy New Year to you too. If you email me an Excel file with your data and test results, I will try to figure out what is happening.
Charles