Example
Example 1: A research group wants to study the effectiveness of three types of training programs (Conflict Management, Psychology and Negotiation) for FBI agents’ preparedness for dealing with local youth who may become involved in terrorist attacks.
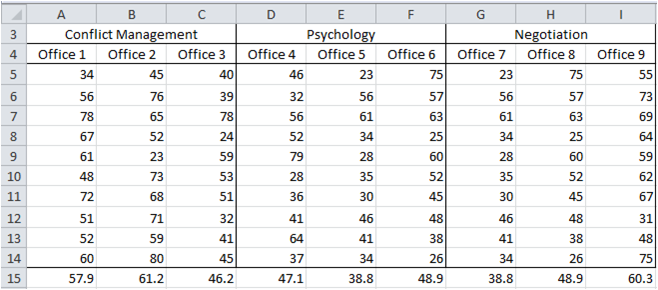
Throughout the country, local FBI field offices have conducted one or more of these types of training. The research group decides to randomly select three field offices that have only conducted Conflict Management training, three field offices that have only conducted Psychology training and three field offices that have only conducted Negotiation training. It then selected 10 FBI agents at random from each of the nine offices and gave each of the 90 agents a test to assess their skills. The results are shown in Figure 1.
Figure 1 – Data for Nested Model
In this example, training program is a fixed factor and field office is a random factor.
For this example, we are only interested in the training program factor and not the field office factor. We could therefore conduct a one-factor ANOVA, ignoring the field office information. The problem with this approach is that perhaps the field office has some impact on the result and can’t simply be ignored.
Issues
We can’t perform a two-way ANOVA since each field office has only one training program and so there are no interaction data. In fact, as Figure 1 captures, we have a nested model whereby the field office factor is nested under the training program factor. Note the difference between this model and the two factor mixed design described in Example 1 of Two Factor Mixed ANOVA. The design for that model is shown in Figure 2 below (as well as in Figure 1 of Two Factor Mixed ANOVA. The model shows there are interactions between the Office and Testing factors).
Figure 2 – Non-nested design
Just as we did in Two-Factor Mixed ANOVA, we first show how to perform the analysis using a modified version of either Excel’s Two Factor ANOVA with Replication data analysis tool or Real Statistics’ Anova: two-factor data analysis tool as shown in Figure 3. The results are similar. We will then show how to perform the analysis using the Real Statistics Nested ANOVA data analysis tool.
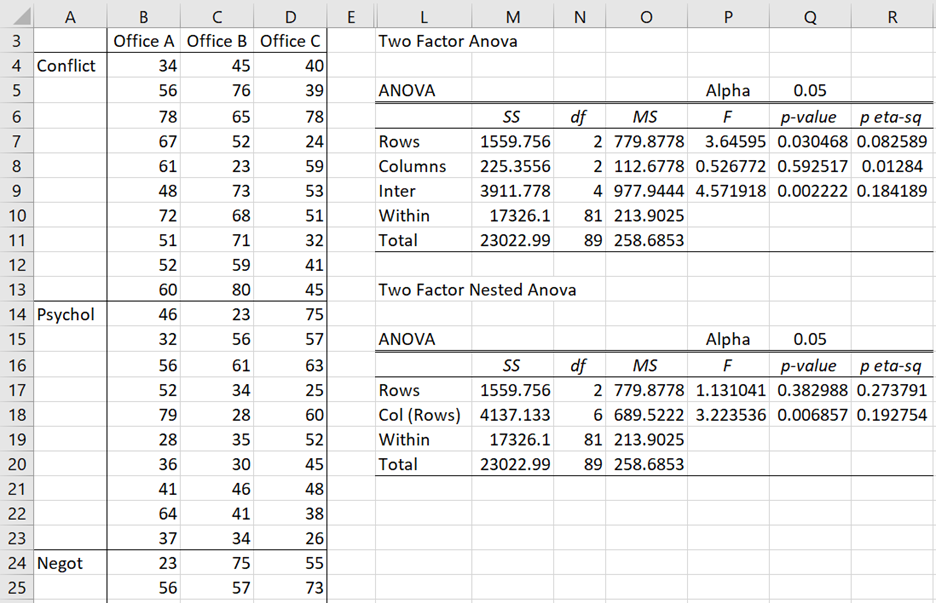
The first thing we need to do is to stack the input data from Figure 1 in the form shown on the left side of Figure 3. Note that all the Conflict Management and Psychology data elements are shown in Figure 3, but only the first two (of ten) rows of the Negotiation data elements are shown due to a lack of space. The complete data is contained in the range A3:D33.
Two-factor Anova approach
We next use the Real Statistics Anova: two-factor data analysis tool on the data in range A3:D33. The output is shown on the upper right side (range L3:R11) of Figure 3.
We now modify this analysis to obtain the nested analysis shown on the bottom right side (range L13:R20) of Figure 3. The following changes are made: cell M18 contains the formula =M8+M9, cell N18 contains the formula =N8+N9 and cell P17 contains the formula =O17/O18 (instead of =O17/O19).
We are not particularly interested in the Col (Rows) effect, but we are interested in the Training effect (labelled Rows). We see from the nested analysis that the Training effect (Factor A) is not significant (cell R17). This is different from the result we obtained from the two fixed factor analysis (cell R7).
Figure 3 – Nested ANOVA
One-way Anova approach
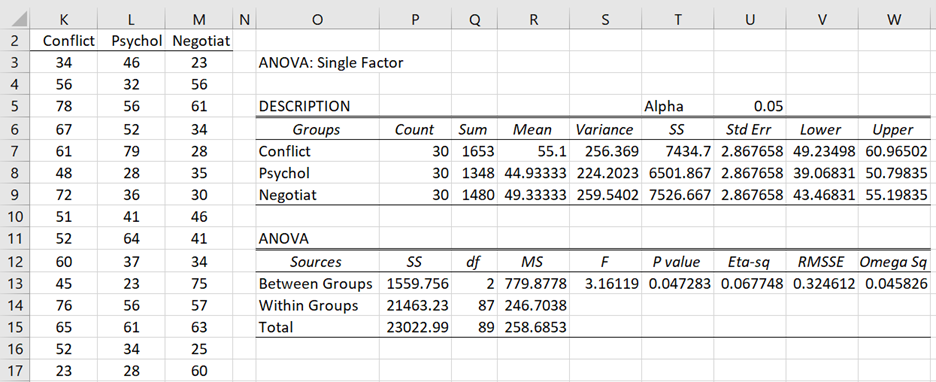
If we ignore the Offices and simply perform a one-way ANOVA, we obtain the results shown in Figure 4.
Figure 4 – One-way ANOVA
Only the first 15 rows of the data are shown on the left side of Figure 4. The actual data range is K2:M32. Note that this data range can be obtained from the data in Figure 1 by inserting the array formula =RESHAPE(G5:I14) in range K2:M32 and pressing Ctrl-Shft-Enter.
As can be seen from cell T13, the one-factor test shows there is a significant difference between the three types of training programs, which as we have seen is an incorrect result. This confirms that even though we are not interested in the offices where the training is taking place this factor makes an important impact on the test results.
Data Analysis Tool
Real Statistics Data Analysis Tool: We can also perform the analysis for Example 1 directly (without having to modify the output as we did in Figure 3) using Real Statistics’ Nested ANOVA data analysis tool.
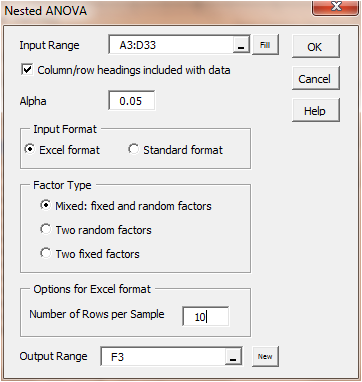
To use this tool for the analysis of Example 1, press Ctrl-m and double click on Analysis of Variance. Next select Nested Anova from the dialog box that appears. Now fill in the dialog box that appears as shown in Figure 5 and click on the OK button.
Figure 5 – Dialog box for Nested ANOVA data analysis tool
The output consists of summary statistics and the ANOVA table shown in range L13:R20 of Figure 3.
Stacked Format
Input data for the Nested ANOVA data analysis tool can be in either Excel format (as shown in Figure 3) or in standard (i.e. stacked) format, as shown in the next example.
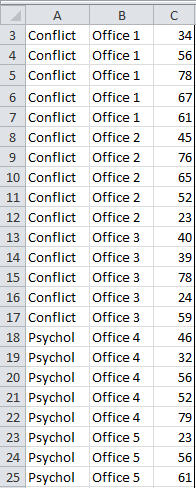
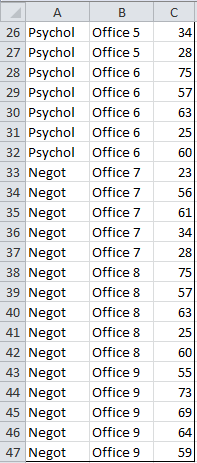
Example 2: Repeat Example 1 with the data in Figure 6 (range A3:C47)
Figure 6 – Data for Nested Anova in standard format
To perform this analysis, press Ctrl-m and double click on Analysis of Variance. Next select Nested Anova from the dialog box that appears. This time when the dialog box shown in Figure 5 appears insert A3:C47 in the Input Range, check Standard Format and click on the OK button.
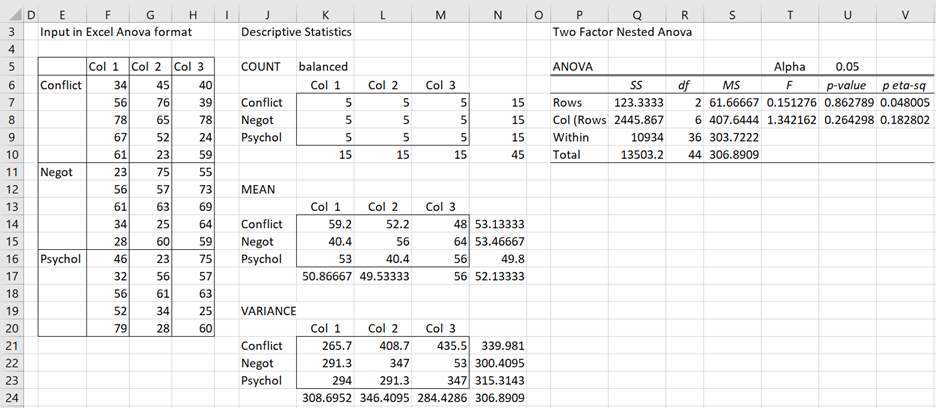
The output is shown in Figure 7.
Figure 7 – Nested ANOVA data analysis
Note that the first thing the data analysis tool does is convert the data from standard format into Excel format, as shown in the range E5:H20 of Figure 7. This is done using the following function.
Worksheet Function
Real Statistics Function: The Real Statistics Resource Pack provides the following array function.
StdNested(R1) – takes data in range R1 in standard format (w/o headings) and outputs a range in Excel Two Factor Nested Anova format (with headings)
Referring to Figure 6, StdNested(A3:C47) produces the output shown in range E5:H20 of Figure 7.
Examples Workbook
Click here to download the Excel workbook with the examples described on this webpage.
References
McDonald, J. H. (2014) Handbook of biological statistics
https://stats.libretexts.org/Bookshelves/Applied_Statistics/Biological_Statistics_(McDonald)
NIST (2014) Two-way nested ANOVA
https://www.itl.nist.gov/div898/handbook/ppc/section2/ppc233.htm
Influential Points (2024) Nested ANOVA principles, properties, assumptions
https://influentialpoints.com/Training/nested_anova-principles-properties-assumptions.htm
Influential Points (2024) Nested ANOVA
https://influentialpoints.com/Training/nested_anovas.htm
Kutner, M. H., Nachtscheim, C. J., Neter, J., Li, W. (2005) Applied Linear Statistical Models, 5th ed. McGraw-Hill
https://users.stat.ufl.edu/~winner/sta4211/ALSM_5Ed_Kutner.pdf
Penn State (2023) Fully nested random effects model: quality control example
https://online.stat.psu.edu/stat502/lesson/6/6.4

Thanks for the post and supports.
In Figure 3, the data setup has, in the rows next to Conflict and following in that section, scores for Conflict under Office A, for Psych under Office B, and for Negot under Office C, rather than results only for Conflict as I was expecting (and which would have required another column to accommodate).
Could you clear up where my misunderstanding about how these data have to be structured to make ANOVA in excel work?
Thanks.
Ken
Hi Ken,
For Conflict, Office A, B, C correspond to Office 1, 2, 3 from Figure 1. For Psych, Office A, B, C correspond to Office 4, 5, 6 from Figure 1. Office A, B, C correspond to Office 7, 8, 9 from Figure 1. The values don’t come from Figure 2.
Charles
Dear Sir,
Thank you for information and resource.
I would like to know how to do three way and four way nested ANOVA using real statistics resource.
Best Regards,
Shailesh
These are not currently supported.
Charles
Hi Charles,
Thank you very much for your post. In my experiment I measured the effect of three treatments on the concentration of carbon at 3 different time points. I am interested in the difference in mean between the 3 treatments on weekly basis. Should I do a 1 way anova with each time point treated as independent data or 2-way anova with the factors being treatment and time?
Hello Taofik,
This depends on the hypothesis or hypotheses) that you want to test. If you are interested in the interaction between the two factors (time and treatment), then you want the two factor version. Keep in mind that you need to use repeated measures ANOVA, and so you probably want the version with one between subjects factor and one within subjects factor.
Charles
Charles,
When you analyze the 2 factor balanced nested model data as 2 random factors or mixed factors, the analysis renders the same F statistics, therefore the p-values for the main and nested factors. For the random factors, we test the variance of the random factors being zero or not, while for the fixed factor, we test the means of individual levels in that factor are the same. Nevertheless, when we test the 2 random vs mixed factors Anova, the test results are the same. If I understood all correctly, then what is the advance to do conduct the mixed model over the random one? One is for the mean vs the other is for variance testing. However, both are ultimately testing the difference in mean effect. Right?
I do appreciate your explanation to shed some light on my question.
-Sun
Charles, i have four independent factors with 3 levels each and one dependent factor. Could you please suggest me, Can i use Nested ANOVA for this?
Hello Tiru,
Real Statistics doesn’t support this number of factors.
If the factors are nested then Nested ANOVA may be appropriate.
This is a large number of factors and may be difficult to interpret even when you find the right tool.
Charles
I have a question. I want to use nested anova test. But in the program I always see alpha muts and number 0 and .5 . I already numbered alpha as 0.05. What can I do?
I just noticed that perhaps I never responded to your comment. If so, please see
https://real-statistics.com/appendix/faqs/comma-as-decimal-symbol/
Charles
I keep getting #DIV/0! in basically all my cells.
Can you use this if you just different treatments and tanks but only one number for each. We did a percentage that reflected mortality over a period of days and only have one number for each and I wanted to do a nested ANOVA to see if there was a tank effect. And to avoid pseudo replication.
CS,
ANOVA is not used with only one element per sample. This probably why you got the error message.
Charles
Hi Charles,
I have a question about the post-hoc test used after the Nested AVOVA. For example, there are four groups: control, treatment A, treatment B and treatment C and I want to compare the effect of different treatment (A, B and C) with control group. Which type of post-hoc test should I use and how to perform this test?
Thanks in advance.
Jia,
In general, when you want to make a comparison between a number of groups and a control group, you can use Dunnett’s test. Real Statistics supports this test for one-way Anova (see Unplanned Comparisons), but not for Nested ANOVA. You would need to figure out how to do this yourself based on the examples given.
Another approach is to use contrasts: e.g. comparing each of the treatment groups with the control (or even the average of the three treatment groups with the control group), but then you would need to correct for experiment-wise error (e.g. Bonferroni). You could also use Tukey HSD, but this would correct for comparisons that you may not be interested in, namely between the three treatment groups.
Charles
Hi Charles,
Many thanks for your explanation. Now I have new questions.
1. Can nested ANOVA be used to compare 2 groups? If not, what kind of nested test should I use?
2. How can I do nested ANOVA test to compare multiple groups with different sample number? for example, group A contains 11 samples, group B has 12 and group C has 13 samples.
Thanks again for your help.
Jia
Jia,
1. Yes, you should be able to use nested ANOVA in this case
2. You should be able to perform nested ANOVA with different sample sizes, but I believe that the Real Statistics software currently only supports groups with the same sample size.
Charles
Hello. When using the nested tool in real-Stats addon it always gives me rows+cols SS in the cols cell, and the rows always equals 0. While the rows+cols that it does give is correct, I can never seem to get the individual values of these two. What am I doing wrong?
TN,
If you send me an Excel file with your data and calculations, I will try to figure out what is going om. You can find my email address at
Contact us
Charles