Basic Approach
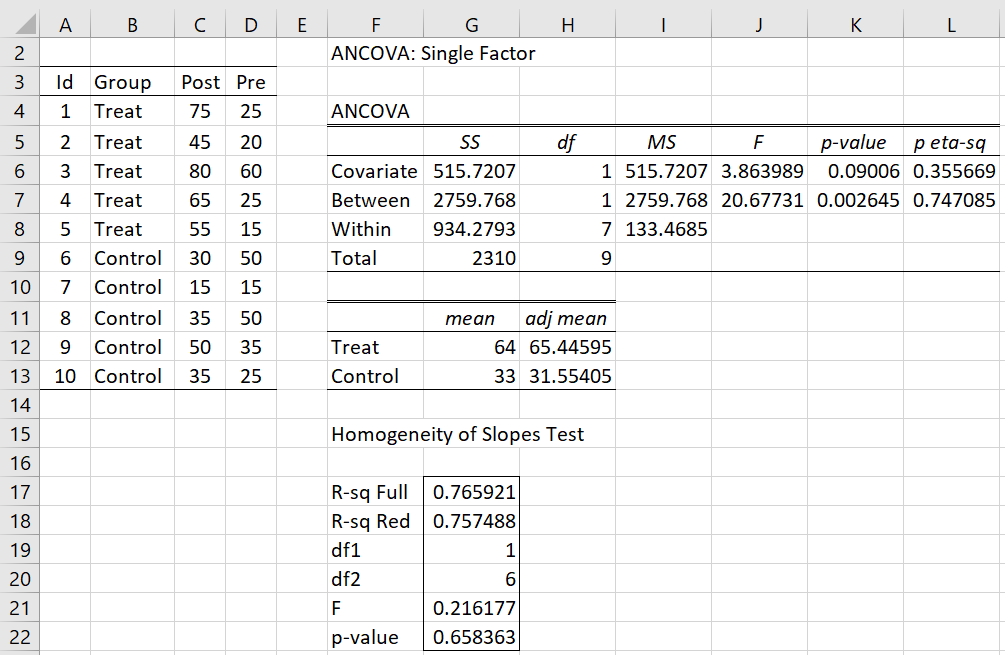
On this webpage, we describe how to use ANCOVA to perform pretest-posttest analysis where the pretest is used as a covariate. This analysis is shown in Figure 1. Note that we reverse the order of the pretest and posttest data (from that shown in Figure 1 of Pretest-Posttest Design) since the Real Statistics ANCOVA data analysis tool requires that the column with the covariate data occurs last when the data is in standard (stacked) format.
Example
Figure 1 – ANCOVA approach
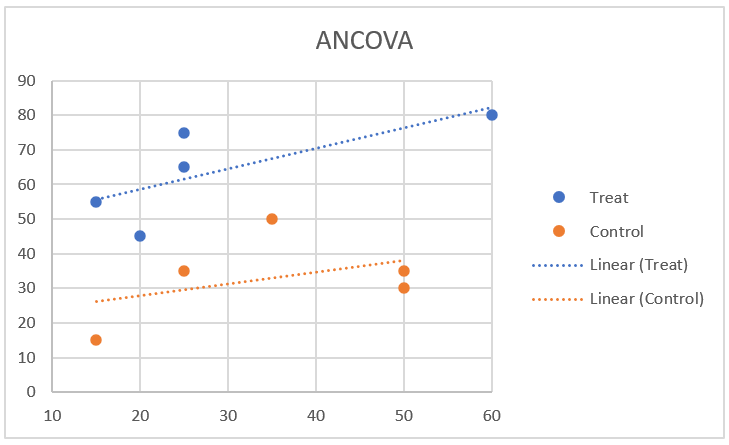
From Figure 1, we also see that the homogeneity of slopes assumption is met (p-value = .66). This is also supported by the results in Figure 2 where we see that the slope lines for The Treatment and Control trend lines (posttest regressed on pretest) are close to parallel.
Figure 2 – Parallel slope lines
For the ANCOVA approach, p-value = .002645, which once again shows that there is a significant difference between the Treatment and Control groups.
Generally, the results from the three approaches described in Pretest-Posttest Design will be similar, although in most cases the ANCOVA approach is preferred since most of the time it will have higher statistical power.
Examples Workbook
Click here to download the Excel workbook with the examples described on this webpage.
Reference
Dimitrov, D. M. and Rumrill Jr., P. D. (2003) Pretest-posttest designs and measurement of change
https://www.academia.edu/6629291/Pretest_posttest_designs_and_measurement_of_change
The Curious Learner (2021) Demystifying statistical analysis: pre-post analysis in 3 ways
https://learncuriously.wordpress.com/2021/06/18/pre-post-analysis/

